Biomed adv. 2(2):83-91.
doi: 10.34172/bma.22
Original Article
Effect of inulin supplementation on MDA level and expression of pyroptosis-related genes in type 2 diabetic patients
Moloud Akbarzadeh Data curation, Methodology, Validation, 1, # 
Erfan Banisefid Validation, Writing – original draft, 2, #
Erfan Mosharkesh Validation, 3
Shilan Maroufi Data curation, Investigation, Methodology, 4
Seyedyashar Pourebrahimian Leilabadi Investigation, 2
Sana Arcan Writing – original draft, 5
Zahra Rafiei Formal analysis, 2
Sama Hasanzadeh Writing – original draft, 6
Alireza Ostadrahimi Conceptualization, Funding acquisition, Resources, Supervision, Writing – review & editing, 4, *
Author information:
1Centre de Recherché de l’Institut Universitaire de Cardiologie et de Pneumologie de Québec (CRIUCPQ), Faculté de Médecine, Université Laval, Québec, QC, Canada
2Student Research Committee, Tabriz University of Medical Sciences, Tabriz, Iran
3Department of Food Hygiene and Aquatic, Faculty of Veterinary Medicine, University of Tabriz, Tabriz, Iran
4Nutrition Research Center, Tabriz University of Medical Sciences, Tabriz, Iran
5Faculty of Arts and Science, Department of Biology and Psychology, University of Toronto, Mississauga, Canada
6Department of Cardiology, Seyyed-al-Shohada Heart Center, Urmia University of Medical Sciences, Urmia, Iran
#Moloud Akbarzadeh and Erfan Banisefid contributed equally as the co-first authors.
Abstract
Summary
Introduction:
Type 2 diabetes mellitus (T2DM) is a chronic metabolic disorder with significant health implications. Probiotic fibers like inulin have shown the potential to improve glucose metabolism by modulating gut microbiota and related signaling pathways. This study focuses on the effect of inulin on malondialdehyde (MDA) level and expression of pyroptosis-related genes (TLR4, ASC, NLRP3, and caspase-1) in type 2 diabetic patients.
Methods:
In the current clinical trial, 46 patients with T2DM were randomly allocated into inulin (n=23) or placebo (n=23) group for eight weeks. Pyroptosis-related genes expression analysis was performed using real-time polymerase chain reaction (PCR).
Findings:
Inulin supplementation significantly reduced weight, body mass index (BMI), and waist/hip circumferences. However, no significant changes were observed in Pyroptosis-related genes expression (TLR4, ASC, NLRP3, caspase-1) or MDA serum levels. Baseline differences in dietary intake were adjusted during the analysis.
Conclusion:
Inulin supplementation is linked to reductions in body weight, BMI, waist and hip circumference. However, no significant association was observed with serum MDA levels or the expression of TLR4, ASC, NLRP3, and caspase-1 genes.
Trial Registration:
Identifier: IRCT201605262017N29; https://irct.behdasht.gov.ir/.
Keywords: Type 2 diabetes, Inulin, Gene expression, Pyroptosis
Copyright and License Information
© 2025 The Author(s).
This is an open-access article distributed under the terms of the Creative Commons Attribution License (
http://creativecommons.org/licenses/by/4.0/), which permits unrestricted use, distribution, and reproduction in any medium, provided the original work is properly cited.
Funding Statement
This research project was funded by a grant from the Research Vice-Chancellor, Tabriz University of Medical Sciences (Grant number: 61223).
Introduction
Diabetes mellitus (DM) is an endocrine metabolic disorder. This metabolic disorder damages several organs, which leads to side effects such as coronary artery disease, and kidney and eye diseases, which can result in disability and death in diabetic patients.1 Among various therapeutic approaches, probiotics, which are non-digestible food components, have attracted significant attention for their ability to improve health by selectively promoting the growth or activity of beneficial gut bacteria.2 Fructooligosaccharides and inulin have been the most common probiotics researched in Europe, Japan, and Australia.3,4 Inulin, an unbranched fructan polymer with 2–60 fructose units, serves as a fermentable dietary fiber with bifidogenic and prebiotic effects. It enhances intestinal function, increases calcium absorption, reduces triglycerides, and produces approximately 1.5 kilocalories of energy per gram.5,6 Furthermore, inulin stimulates the production of glucagon-like peptide-1 (GLP-1) by gut L cells, thereby improving insulin sensitivity and hepatic metabolism.7-10 Toll-like receptor-4 (TLR4) is the main receptor in recognition of gram-negative bacteria. At the molecular level, the TLR4 receptor plays a central role in immune signaling and has been implicated in T2DM pathogenesis. Overexpression of TLR4 has been linked to complications like diabetic cardiomyopathy, suggesting that its inhibition may provide a novel therapeutic avenue.11-14 Nucleotide-binding oligomerization domain, leucine-rich repeat, and pyrin domain containing-3 (NLRP3) gene is a tripartite protein that consists of a central NACHT domain, a carboxy-terminal leucine-rich repeat domain, and amino-terminal pyrin domain.15 Inflammasomes are cytosolic receptors that can identify microbial pathogens and endogenous dangerous signals resulting from stress or cell damage. Activation of inflammasome causes the activation of inflammatory caspase called caspase-1 and as a result the pyroptosis pathway. Pyroptosis is a programmed cell death dependent on caspase-1 and inflammation, which is activated by various inflammatory diseases, including T2DM, so the activity of NLRP3 and caspase-1 in obese people and T2DM patients increases.16-18 The NLRP3 inflammasome regulates inflammation, immune responses, and apoptosis via NF-kB signaling and is linked to diabetic nephropathy and the protection of pancreatic β-cells against damage.19-22 ASC is a protein that is mostly seen in the nucleus of monocytes and macrophages. Still, it can quickly change its place and go to the cytoplasm, the space around the nucleus, endoplasmic reticulum, and mitochondria. It is the most important intermediate protein in inflammasome activation.23,24 In addition, ASC plays a key role in inducing inflammatory responses in inflammatory diseases including gout, T2DM, atherosclerosis, metabolic syndrome, chronic obstructive pulmonary disease, spinal cord injury, and Alzheimer’s disease.25-27 In T2DM, elevated free radical levels coupled with reduced antioxidant defenses result in tissue and enzyme damage, increased lipid peroxidation, and insulin resistance.28,29 Reactive oxygen species (ROS) interact with nitric oxide and decrease superoxide dismutase levels, an essential antioxidant enzyme, and further exacerbating lipid peroxidation. This process produces toxic aldehydes such as malondialdehyde (MDA), a key marker of lipid peroxidation and oxidative stress. Early research has demonstrated increased MDA levels in individuals with diabetes mellitus, suggesting heightened ROS generation and lipid peroxidation.30-33 Given the limited research on inulin supplementation, its potential to modulate key genes in the pyroptosis pathway, and its overall benefits in DM management, this study aims to investigate the effect of inulin supplementation on pancreatic β-cell pyroptosis and the expression of TLR4, ASC, NLRP3, and caspase-1 genes in T2DM patients.
Methods
Study design
This study is a randomized, double-blind, placebo-controlled clinical trial with a parallel design (allocation ratio 1:1). Participants were matched based on their BMI, gender, and age. The randomization sequence was generated using random allocation software (RAS). Independent of the trial proceedings, a statistician meticulously conducted the randomization and allocation process, ensuring an unbiased distribution of participants to the different study groups. All participants, investigators, and statisticians remained completely blinded to the treatment assignments throughout the study. This blinding persisted until the comprehensive analysis of the collected data was finalized, safeguarding the integrity of the study outcomes and minimizing potential biases. The primary objective was to investigate the cause-and-effect relationship between the independent and dependent variables. Given the human-based nature of the study and the inherent challenges in fully controlling confounding factors, participants were purposefully selected based on specific inclusion criteria.
Population and statistical sample
Forty six patients with T2DM from Tabriz city (30 to 50 years old) with fasting plasma glucose (FPG) levels ≥ 126 mg/dL who visited the clinic of Tabriz University of Medical Sciences, Tabriz, Iran in 2020 were included in this study. The sample size was determined with a power of 90% and a confidence level of 95%, referencing findings from a study by Dehghan et al,30 focusing on fasting insulin as the primary outcome, using the formula: n ¼ [(Z1-α/2 + Z1-b)2 _ (SD12 + SD22] / (Mean1 - Mean2)2, with α = 0.05 and β = 0.1. This resulted in a required sample size of 16 participants per group, which was later adjusted to 23 individuals to accommodate a dropout rate of 35%. Informed consent was obtained from all patients. Inclusion criteria consisted of a history of T2DM lasting more than six months, a body mass index (BMI) ranging from 25 to 35 kg/m2 over the past three months, no fluctuations in weight during the last three months, the use of metformin or glibenclamide, or a combination of both for blood sugar management, not using insulin, maintaining a consistent physical activity level, and following a regular dietary regimen. Participants were randomly allocated to one of two groups: the inulin or the placebo group, with 23 participants each. The nature, goals, and risks of this study were explained to the people in a face-to-face meeting before starting the research and written consent was obtained from them to participate in this study. Exclusion criteria were unwillingness to continue participating in the survey, renal disease (eGFR < 60 mL/min/1.73 m2) and liver failure (ALT/AST > 2x normal limit), heart failure, rheumatic diseases and inflammatory diseases of the gastrointestinal tract, receiving insulin therapy, taking corticosteroids and non-steroidal anti-inflammatory drugs, multivitamins, and antioxidants during the last three months before the onset of the research, currently consuming prebiotics, probiotics, or antibiotics, smoking, pregnancy, breastfeeding. The primary outcomes of this study were alterations in the pyroptosis signaling pathways. In addition, evaluation of weight, BMI, waist circumference, hip circumference, lipid profile, glucose homeostasis indices, and MDA status were considered as secondary outcomes.
Data collection
The entire research process, including supplementation, goals, and potential risks, was thoroughly explained to the participants during an initial meeting, where their demographic information was also collected. One week before the study, participants attended a familiarization session to learn how to conduct the interventions. Blood samples were collected from both groups the day before the tests commenced. For eight weeks, one group received an inulin supplement as a powder at a daily dose of 10 g, while the other group was given a placebo consisting of maltodextrin powder. The inulin powder branded as Sensus Company in New Zealand produced Inulin HP, whereas the maltodextrin powder was manufactured by Jiujiang Hurirong Trade Company in China. It is important to note that these two powders were similar in both appearance and taste. While precise nutritional control was unattainable, the participants’ diets during the eight weeks were assessed using a 24-hour nutrition recall questionnaire. Information regarding the participants’ food intake was gathered through a 24-hour food diary via an interview method. This questionnaire was utilized in both groups before and after the intervention to evaluate food consumption status. Subsequently, the quantities of each food item were converted to grams using a home scale guide and analyzed using NUT4 software. After the eight weeks, fasting blood samples were collected from both groups.
Sample collection and measuring variables
A 6 cc blood sample was acquired from the central basilic vein of subjects both pre-and post-intervention. The collected samples were immediately transferred into sterile K3EDTA tubes. Heparin and EDTA tubes were kept on ice before acclimatizing to room temperature for a brief period. After this, serum was separated from plasma via centrifugation at 3500 RPM for 10 minutes. All blood samples were then aliquoted and stored at -80 °C for subsequent laboratory analyses. Each sampling procedure was standardized across all subjects to maintain consistency. The expression levels of TLR4, ASC, NLRP3, caspase-1, IL-1β, and IL-18 genes were quantified using a real-time polymerase chain reaction (PCR) technique. Additionally, the subjects’ height and weight were recorded to compute their BMI.
Statistical analysis
SPSS 21 software was utilized for the analysis. All variables are presented as mean ± standard error. The Kolmogorov-Smirnov test was employed to assess the normality of data distribution. A paired t test was conducted to compare the study results before and after the intervention within each group. Quantitative variables were described using either mean (standard deviation) or median (interquartile range), depending on the conditions, while frequency (percentage) was used for qualitative variables. To compare the means of quantitative results between the two studied groups, either the independent t test or the Mann-Whitney test was applied. For comparing results before and after the intervention within each group, the paired t test or Wilcoxon test was utilized. The chi-square test or Fisher’s exact test was used to compare qualitative factors between the two groups. A P value of less than 0.05 was considered statistically significant.
Results
Participants
A total of 46 participants were assigned randomly to groups (intervention group, n = 23; placebo group, n = 23). Out of 46 selected patients for this study, 40 participants completed the trial. (See CONSORT flow chart, Figure 1). No significant issues were observed following inulin supplementation, and both groups showed no notable differences in age or gender (Table 1).
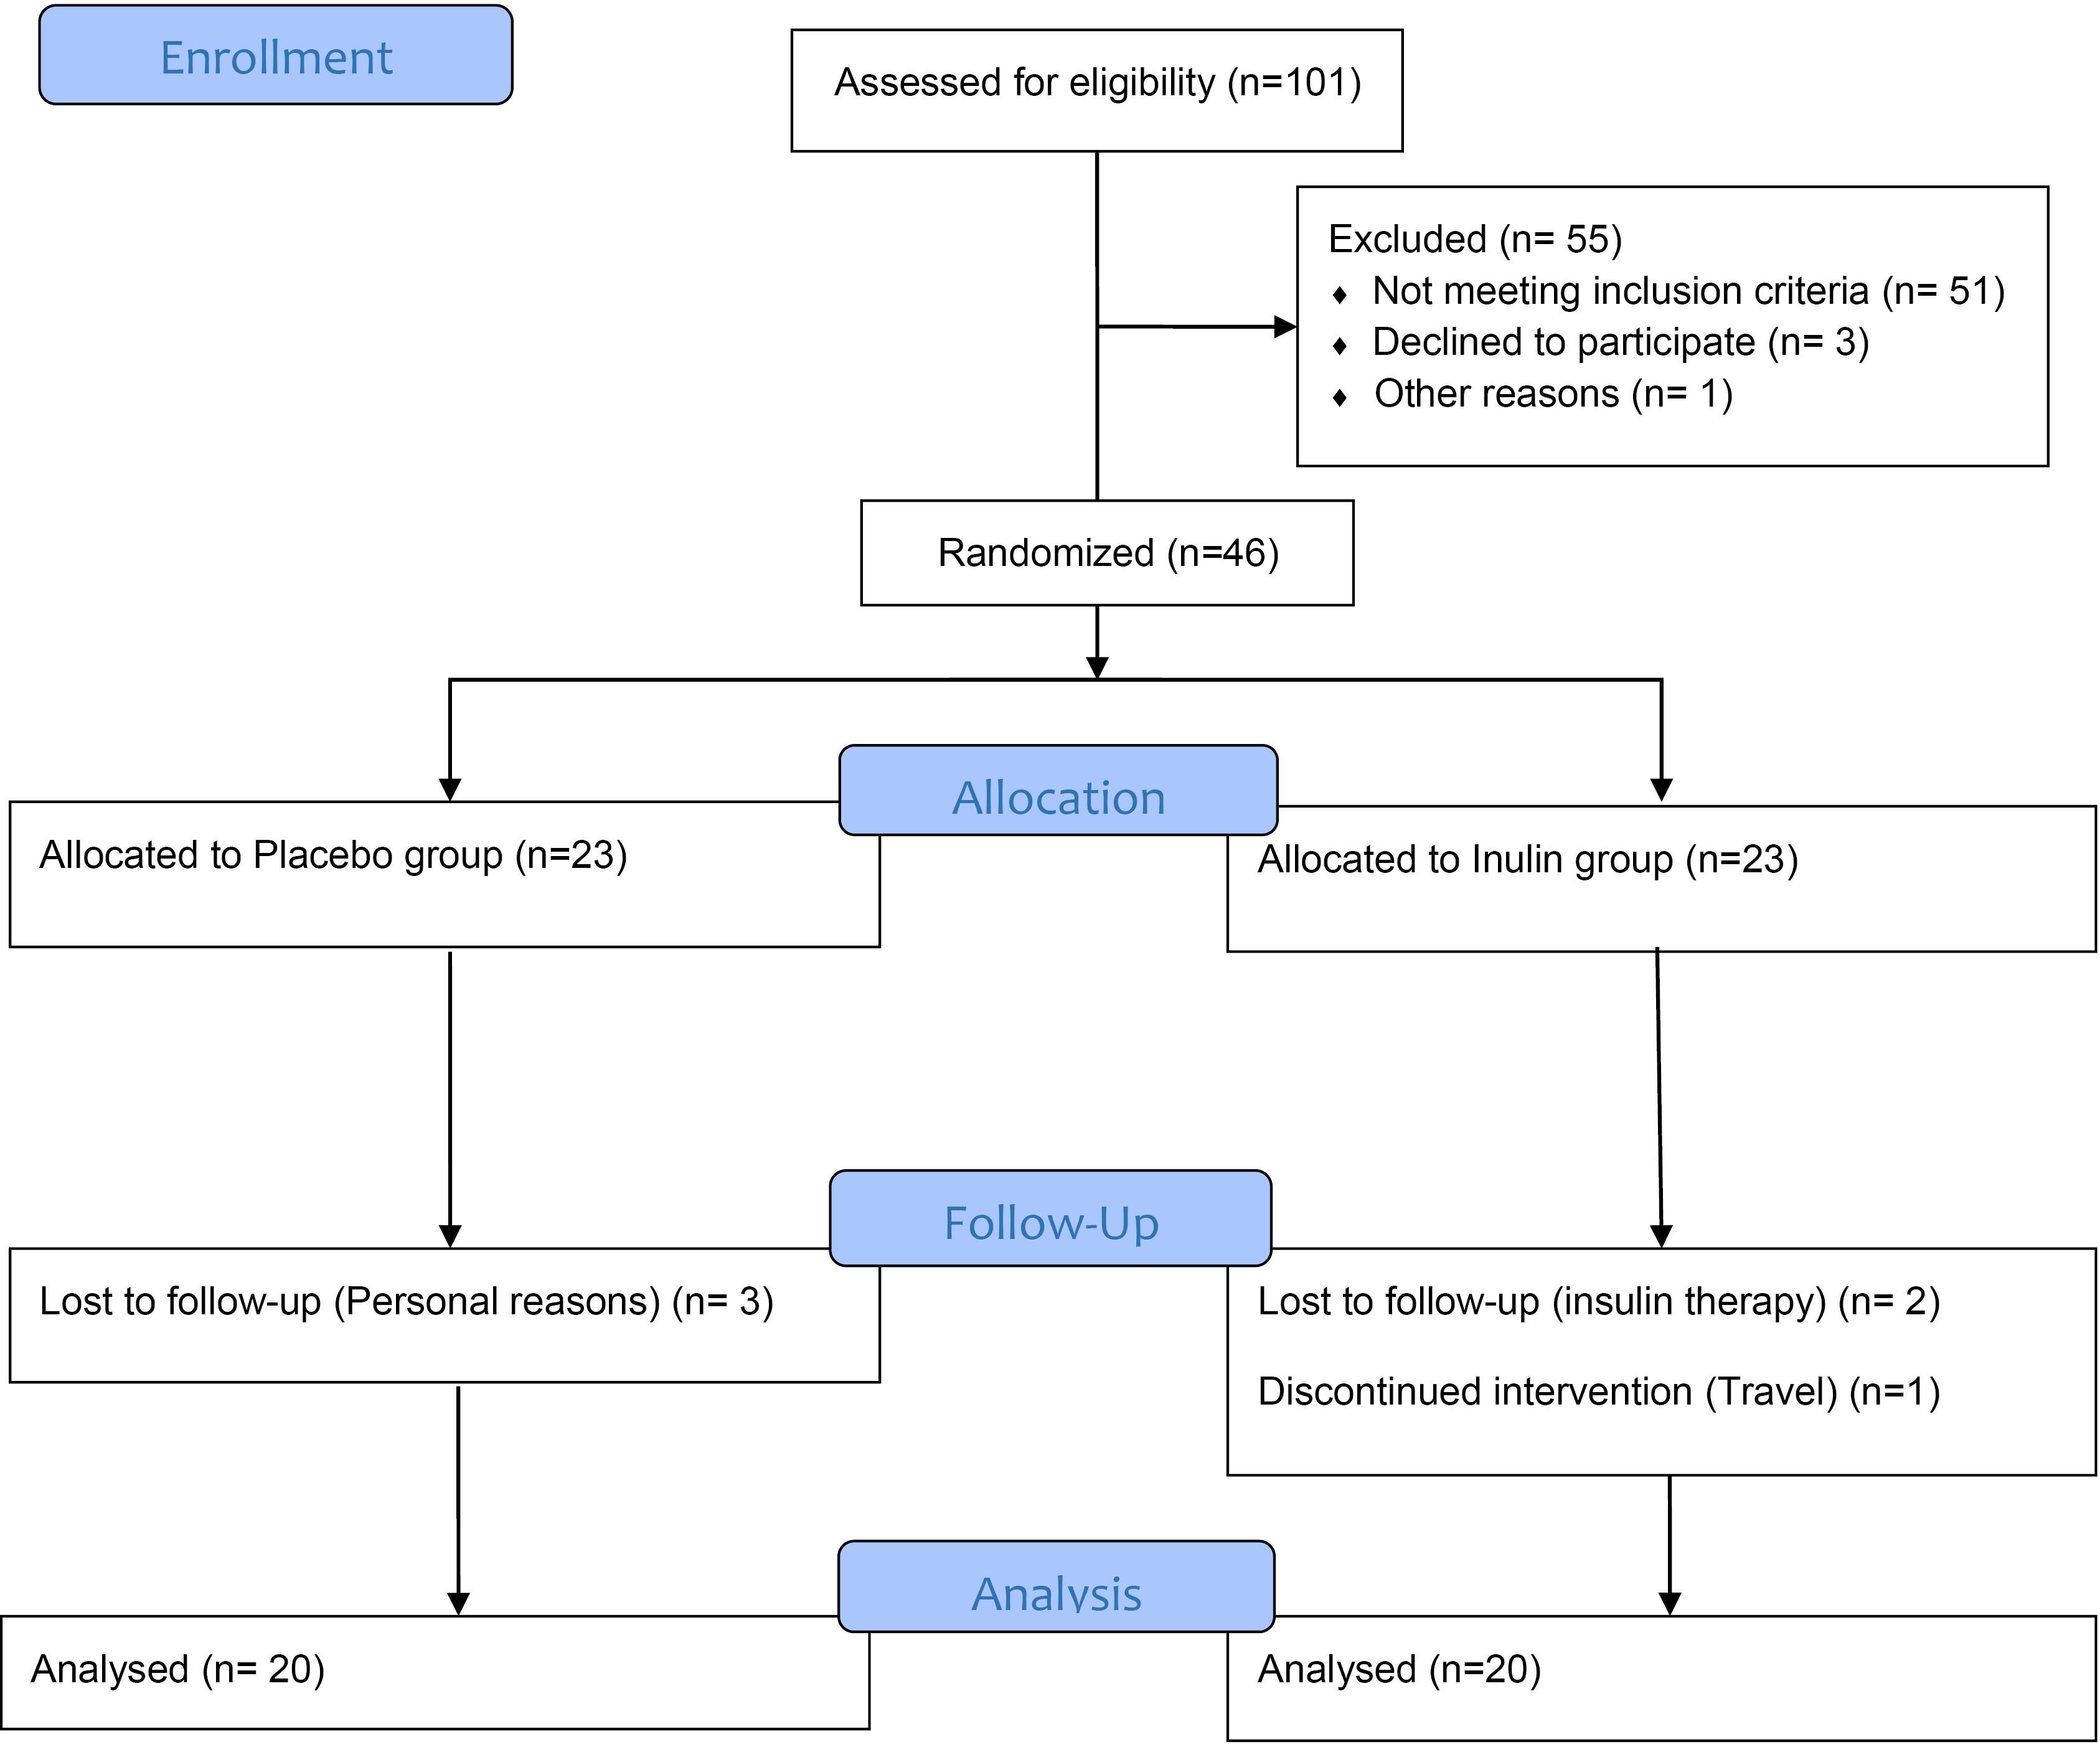
Figure 1.
Flowchart of design and protocol of the study
.
Flowchart of design and protocol of the study
Table 1.
Comparison of age and gender variables between intervention and placebo groups
|
Variablea
|
Inulin (n=20)
|
Placebo (n=20)
|
P
valueb
|
| Age (y) |
50.80 (6/89) |
55.50 (8/08) |
0.917 |
| Gender |
Male |
12 (60) |
6 (30) |
0.057 |
| Female |
8 (40) |
14 (70) |
a The age variable is expressed as mean (standard deviation) and the gender variable is expressed as frequency (percentage).
b An independent t-test was used to compare quantitative variables and a chi-square test to compare qualitative variables.
Anthropometric indices and nutrient intake
There was no significant difference in age between the two groups (P = 0.917). Additionally, although the group receiving inulin had a higher percentage of men, and the placebo group had a higher percentage of women, this difference was not statistically significant (P = 0.057). In Table 2, we compare the energy, carbohydrates, protein, and fat intakes of the two groups at the beginning and end of the study. Initially, the group receiving inulin had significantly higher energy (P = 0.035) and carbohydrate (P = 0.003) intakes than the control group. There were no significant differences between the two groups in terms of fat intake (P = 0.431) and protein intake (P = 0.303) at the study’s start. By the end of the study, there were no significant differences in energy (P = 0.739), carbohydrate (P = 0.602), protein (P = 0.726), or fat (P = 0.639) intake between the two groups. An intra-group comparison revealed no significant changes in energy, carbohydrate, protein, or fat intake in the intervention group. However, individuals in the placebo group showed an increase in energy (P = 0.002), carbohydrates (P = 0.004), and fat (P = 0.027) intake by the end of the study. Table 3 compares the anthropometric variables between the two groups. The intervention group had a higher average height than the control group (P = 0.029). Initially, there were no significant differences in weight (P = 0.262), BMI (P = 0.534), waist circumference (P = 0.345), hip circumference (P = 0.554), or the waist-to-hip ratio (P = 0.517) between the two groups. By the end of the study, the inulin group experienced significant decreases in weight (P = 0.008), BMI (P = 0.009), waist circumference (P = 0.040), and hip circumference (P = 0.010). In the placebo group, only the decrease in waist circumference was statistically significant (P = 0.002). Nonetheless, the comparison of the changes between the two groups did not reveal significant differences (P < 0.05). Table 4 presents a comparison of laboratory findings between the two groups before and after the study.
Table 2.
Comparison of energy intake and macronutrients between two intervention and placebo groups at the beginning and end of the study
|
Variablea
|
Inulin (n=20)
|
Placebo (n=20)
|
P
valueb
|
| Energy intake (kcal) |
Before |
2052.39(560.26) |
1624.00(393.59) |
0.035* |
| After |
1957.83 (505.04) |
2124.55 (650.37) |
0.739 |
| Changes |
-94.55 (522.66) |
500.55 (498.01) |
< 0.01* |
|
P valuec |
0.280 |
< 0.01* |
|
| Carbohydrate intake (g) |
Before |
317.93 (115.22) |
214.74 (70.67) |
< 0.01* |
| After |
259.94 (55.09) |
269.15 (52.24) |
0.602 |
| Changes |
-58.00 (118.84) |
54.41 (71.18) |
< 0.01* |
|
P valuec |
0.061 |
< 0.01* |
|
| Protein intake (g) |
Before |
80.45 (23.77) |
71.41 (23.27) |
0.303 |
| After |
78.75 (25.08) |
82.18 (32.53) |
0.726 |
| Changes |
-1.69 (14.15) |
10.76 (17.99) |
0.033* |
|
P valuec |
0.609 |
0.053 |
|
| Fat intake (g) |
Before |
54.31 (29.46) |
56.03 (18.66) |
0.431 |
| After |
70.45 (32.02) |
78.94 (44.30) |
0.639 |
| Changes |
16.14 (37.99) |
22.91 (37.44) |
0.593 |
|
P valuec |
0.057 |
0.027* |
|
a Is expressed as mean (standard deviation).
b Independent t test was used to compare quantitative variables with normal distribution and the Mann-Whitney U test to compare quantitative variables with non-normal distribution.
c Paired t test was used to compare a quantitative variable with a normal distribution and the Wilcoxon test to compare a quantitative variable with a non-normal distribution.
Table 3.
Comparison of anthropometric variables between intervention and placebo groups at the beginning and end of the study
|
Variablea
|
Inulin (n=20)
|
Placebo (n=20)
|
P
valueb
|
| Height (m) |
1.69 (0.08) |
1.62(0.10) |
0.29* |
| Weight (kg) |
Before |
85.67 (10.19) |
80.91 (15.65) |
0.262 |
| After |
84.79 (9.98) |
80.55 (15.37) |
0.308 |
| Changes |
-0.88 (1.33) |
-0.36 (1.41) |
0.244 |
|
P valuec |
< 0.01* |
0.270 |
|
| BMI (Kg/m2) |
Before |
29.85 (2.98) |
30.70 (5.27) |
0.534 |
| After |
29.54 (2.96) |
30.70 (5.21) |
0.452 |
| Changes |
-0.31 (0.46) |
-0.13 (0.46) |
0.270 |
|
P valuec |
< 0.01* |
0.241 |
|
| Waist circumference (cm) |
Before |
100.89 (7.69) |
97.43 (12.48) |
0.345 |
| After |
98.52 (8.71) |
94.68 (10.99) |
0.257 |
| Changes |
-2.37 (4.67) |
-2.75 (2.91) |
0.491 |
|
P valuec |
< 0.01* |
0.04* |
|
| Hip circumference (cm) |
Before |
109.31 (5.94) |
107.40 (11.12) |
0.554 |
| After |
107.52 (5.60) |
106.33 (10.84) |
0.703 |
| Changes |
-1.79 (2.72) |
-1.07 (2.43) |
0.427 |
|
P valuec |
0.01* |
0.112 |
|
| The ratio of waist circumference to hip circumference |
Before |
0.92 (0.08) |
0.90 (0.08) |
0.517 |
| After |
0.91 (0.08) |
0.88 (0.06) |
0.259 |
| Changes |
-0.01 (0.05) |
-0.02 (0.04) |
0.0224 |
|
P valuec |
0.549 |
0.070 |
|
BMI: Body mass index.
a Is expressed as mean (standard deviation).
b Independent t test was used to compare quantitative variables with normal distribution and the Mann-Whitney U test to compare quantitative variables with non-normal distribution.
c Paired t test was used to compare a quantitative variable with a normal distribution and the Wilcoxon test to compare a quantitative variable with a non-normal distribution.
Table 4.
Comparison of laboratory findings between two intervention and placebo groups at the beginning and end of the study
|
Variablea
|
Inulin (n=20)
|
Placebo (n=20)
|
P
valueb
|
| FBS (mg/dL) |
Before |
163.65 (73.34) |
136.15 (30.85) |
0.219 |
| After |
144.325 (53.99) |
136.65 (26.72) |
0.906 |
| Changes |
-19.30 (57.56) |
1.50 (23.92) |
0.344 |
|
P valuec |
0.155 |
0.635 |
|
| 2hBS (mg/dL) |
Before |
218.53 (79.15) |
182.53 (61.42) |
0.126 |
| After |
210.58 (87.29) |
163.82 (67.10) |
0.083 |
| Changes |
-12.50 (65.26) |
-22.37 (53.96) |
0.636 |
|
P valuec |
0.428 |
0.118 |
|
| Insulin |
Before |
2.49 (3.29) |
2.14 (1.74) |
0.966 |
| After |
1.69 (1.02) |
1.74 (0.76) |
0.682 |
| Changes |
-0.80 (3.31) |
-0.40 (1.49) |
0.966 |
|
P valuec |
0.503 |
0.536 |
|
| HOMA-IR |
Before |
0.84 (0.85) |
0.70 (0.60) |
0.776 |
| After |
0.60 (0.35) |
0.59 (0.29) |
0.960 |
| Changes |
-0.24 (0.91) |
-0.12 (0.51) |
0.755 |
|
P valuec |
0.535 |
0.646 |
|
| HbA1c (%) |
Before |
8.57 (2.44) |
7.66 (1.66) |
0.206 |
| After |
8.21 (1.87) |
7.35 (1.17) |
0.104 |
| Changes |
-0.08 (0.96) |
-0.31 (0.86) |
0.449 |
|
P valuec |
0.910 |
0.172 |
|
| TG (mg/dL) |
Before |
265.25 (240.75) |
163.45 (91.44) |
0.078 |
| After |
188.10 (80.74) |
175.55 (75.69) |
0.615 |
| Changes |
-77.15 (182.87) |
12.10 (58.38) |
0.02* |
|
P valuec |
0.075 |
0.366 |
|
| Total cholesterol (mg/dL) |
Before |
178.60 (81.44) |
156.70 (24.34) |
0.261 |
| After |
157.05 (43.10) |
166.35 (27.53) |
0.283 |
| Changes |
-21.55 (72.13) |
9.65 (22.27) |
0.091 |
|
P valuec |
0197 |
0.068 |
|
| HDL-C (mg/dL) |
Before |
37.00 (9.39) |
36.65 (8.15) |
0.901 |
| After |
38.26 (8.49) |
44.05 (31.62) |
0.944 |
| Changes |
1.26 (4.36) |
7.40 (31.38) |
0.621 |
|
P valuec |
0.258 |
0.447 |
|
| LDL-C (mg/dL) |
Before |
88.47 (52.12) |
87.31 (25.70) |
0.250 |
| After |
79.12 (38.65) |
90.55 (26.20) |
0.284 |
| Changes |
-9.85 (55.60) |
3.24 (20.08) |
0.790 |
|
P valuec |
0.702 |
0.263 |
|
FBS: Fasting blood sugar, 2hBS: Blood sugar two hours after breakfasting, Homa-IR: Homeostatic Model Assessment - Insulin Resistance, HbA1c: glycated hemoglobin test, TG: Triglyceride, HDL: High-density lipoprotein, LDL: Low-density lipoprotein.
a Is expressed as mean (standard deviation).
b An independent t test was used to compare quantitative variables with normal distribution and a Mann-Whitney U test to compare quantitative variables with non-normal distribution.
c Paired t test was used to compare a quantitative variable with a normal distribution and the Wilcoxon test to compare a quantitative variable with a non-normal distribution.
Glycemic markers, lipid profile, MDA
At both points in time, there were no significant differences between the groups regarding fasting blood sugar, two-hour blood sugar, insulin, insulin resistance index (HOMA-IR), and HbA1c (P < 0.05). The changes in these variables between the two groups were also not statistically significant. Intra-group comparisons showed no significant changes in fasting blood sugar, two-hour blood sugar, insulin, HOMA-IR, and HbA1c from the beginning to the end of the study (P > 0.05). There were no significant differences between the groups regarding serum triglyceride (TG), total cholesterol, high-density lipoprotein (HDL-c), and low-density lipoprotein (LDL-c) levels before and after the study (P > 0.05). However, there was a significant difference in the changes of serum triglyceride levels between the two groups (P = 0.020). Intra-group comparisons showed no significant changes in serum levels of TG, total cholesterol, HDL-c, and LDL-c at the end of the study compared to the beginning (P > 0.05). Table 5 compares the serum levels of MDA between the two groups at both the beginning and end of the study. There were no significant differences between the groups in terms of serum MDA levels at the end of the study (P = 0.318). Despite a decrease in the serum level of MDA, no significant change was observed in any group during intra-group comparisons (P > 0.05).
Table 5.
Comparison of the serum level of MDA between two intervention and placebo groups at the beginning and end of the study
|
Variablea
|
Inulin (n=20)
|
Placebo (n=20)
|
P
valueb
|
Adjusted
P
valuec
|
| Serum MDA |
Before |
1.93 (0.89) |
2.05 (1.12) |
0.815 |
0.447 |
| After |
1.77 (0.65) |
2.00 (0.69) |
0.318 |
0.074 |
| Changes |
-0.15 (0.87) |
-0.05 (1.15) |
0.767 |
0.07 |
|
P valued |
0.476 |
0.855 |
|
|
MDA: malondialdehyde.
a Is expressed as mean (standard deviation).
b Using Independent t-test.
c Using ANCOVA test by adjusting the effect of variables adjusting the effect of sex, height, energy, carbohydrate, protein, and fat intake.
d Using paired t-test.
Gene expression levels (TLR4, NLRP3, caspase-1, and ASC)
Table 6 shows the comparison of gene expression levels for TLR4, NLRP3, caspase-1, and ASC between the intervention and placebo groups at the beginning and end of the study (P > 0.05). Furthermore, even after adjusting for the effects of gender and energy, carbohydrate, protein, and fat intake, no significant differences were found between the two groups in the mentioned gene expressions.
Table 6.
Comparison of gene expressions between intervention and placebo groups at the beginning and end of the study
|
Variablea
|
Inulin (n=20)
|
Placebo (n=20)
|
P
valueb
|
Adjusted
P
valuec
|
| TLR4 gene expression |
12.16 (32.12) |
0.96 (0.83) |
0.171 |
0.824 |
| Logarithm of TLR4 gene expression |
0.01 (0.89) |
-0.27 (0.63) |
0.285 |
0.527 |
| NLRP3 gene expression |
1.09 (1.52) |
0.76 (0.75) |
0.408 |
0.924 |
| Logarithm of NLRP3 gene expression |
-0.25 (0.48) |
-0.43(0.70) |
0.357 |
0.944 |
| Caspase-1 gene expression |
1.64 (2.06) |
1.02 (1.29) |
0.276 |
0.953 |
| Logarithm of Caspase-1 gene expression |
-0.02 (0.45) |
-0.29 (0.59) |
0.125 |
0.575 |
| ASC gene expression |
0.83 (1.20) |
1.36 (1.30) |
0.204 |
0.129 |
| The logarithm of ASC gene expression |
-0.31 (0.43) |
-0.36 (1.09) |
0.868 |
0.514 |
a Is expressed as mean (standard deviation).
b Using Independent t test.
c By using ANCOVA test by adjusting the effect of variables adjusting the effect of sex, height, energy, carbohydrate, protein, and fat intake.
Discussion
The study’s results show a substantial correlation between receiving 10 g of inulin powder and a reduction in weight, BMI, waist circumference, and hip circumference. However, in the inulin group, there was an obvious decrease in diastolic blood pressure (DBP). Before and after the intervention, there was no discernible change in either group’s serum MDA level or the expression of the TLR4, ASC, NLRP3, and caspase1 genes.
In research by Dehghan et al receiving inulin supplementation was significantly associated with a decrease in weight and BMI.30 However, the systematic review by Rao et al found that receiving inulin supplementation had no significant relation with a decrease in the BMI of patients.31 In this study, a significant decrease in weight, BMI, waist circumference, and hip circumference was observed in the group receiving inulin compared to the beginning of the study. Becerril-Alarcón et al suggest that inulin supplementation reduces systolic blood pressure (SBP) in women with breast cancer.32 Furthermore, in another study by Beretta et al, it was found that a group supplemented with inulin for 21 days had a significant reduction in SBP, but not in DBP.33 This can explain that this type of cardiovascular response could be due to changes in sympathetic activity and the renin-angiotensin system derived from inulin metabolism in gut microbiota.34,35 Similarly, in another study by Roshanravan et al, inulin supplementation was suggested to have reduced DBP in comparison with the placebo group.36 This study showed a significant decrease in DBP (10.50 ± 10.00 mm Hg) in the group receiving inulin. Few mostly inhomogeneous studies have investigated the impact of inulin supplementation on appetite, hunger sensations, and food intake in the adult population previously. One of them is the study by Salmean in which it was found that consuming 16 g/d of inulin-type fructans in the morning for 7 days, and after an overnight fast, curbed appetite sensations and helped reduce food intake during lunch meals.37 However, the results of this study showed that at the end of the study, there was no significant difference in energy, carbohydrate, protein, and fat intake between the two groups. Dehghan et al also reported that 8 weeks of inulin supplementation significantly decreased FBS, HbA1c, total cholesterol (TC), TG, and LDL-c in the intervention group compared with the control group.30 Moreover, Jackson et al showed that prebiotic supplementation (10 g/d inulin for 8 weeks in individuals with mild hyperlipidemia) decreased fasting insulin and TG.38 Inulin-enriched pasta also showed a significant decrease in glycemic status and improved lipid profile in healthy young volunteers.39 Visuthranukul et al reported that inulin supplementation had no significant effect on TC, LDL-C, HDL-C, and TG after the intervention.40 In a systematic review by Zhang et al, it was found that inulin supplementation can significantly improve FBS, HOMA-IR, and HbA1c.41 The results of this study showed that there was no significant difference between the two groups in terms of serum levels of TG, TC, HDL-C, and LDL-C before and after the study. However, there was a significant difference in serum TG levels between the two groups as inulin-receiving participants had a decrease in serum TG whereas placebo-receiving participants had an increase. The results of this study also showed no significant difference between the two groups in terms of FBS, 2-hour blood sugar, insulin, HOMA-IR, and HbA1c at the beginning and end of the study. Also, the comparison of the changes in these variables between the two groups was not statistically significant. The difference in results obtained in several studies may be due to the pathologic state and basal levels of fasting blood sugar and lipid profile as well as the intervention time, type, and dose of inulin supplementation. Previous studies suggest that inulin intake can modulate TLR4 expression in the gut mucosa, potentially influencing the inflammatory response and overall immune function. By promoting a healthier balance of gut microbiota and supporting gut barrier function, inulin may regulate TLR4 signaling and promote immune homeostasis.42,43 The results of this study showed that despite the higher expression of the TLR4 gene in the inulin group, this difference between the two studied groups was not statistically significant. Inulin intake has been shown to have a potential impact on NLRP3 expression.44 Studies have suggested that inulin can modulate the gut microbiota composition, leading to changes in the production of short-chain fatty acids (SCFAs) like butyrate. These SCFAs may play a role in regulating NLRP3 expression and activity.45 Furthermore, inulin has been linked with reducing systemic inflammation and improving gut barrier function, which could indirectly influence NLRP3 expression by maintaining gut homeostasis.46,47 However, a recent study by Singh et al reported that inulin was not related to the attenuation of colonic inflammation in an immune-mediated mouse colitis model which was related to NLRP3 pathways.48 In another study, Chen et al studied the increase in NLRP3 gene expression in people with diabetic retinopathy. They observed increased gene and protein expression of NLRP3, ASC, and caspase 1 in peripheral mononuclear cells of adults with diabetic retinopathy compared to the control group. Higher expressions of NLRP3 and ASC were observed in fibrovascular membranes from 21 adults with proliferative diabetic retinopathy compared to 22 controls.49 The results of this study demonstrated that the difference was not statistically significant in the field of NLRP3 expression level. In addition, despite the increase in the average expression of the caspase-1 gene in the group receiving inulin, no statistically significant difference was observed between the two groups. Also, inulin supplementation decreased the expression of the ASC gene, and receiving a placebo was associated with increasing the expression of this gene, but this difference was not statistically significant. The lack of statistically significant conclusions about the expression of studied genes can be related to the short duration of inulin supplementation or its insufficient dose.
This research had some limitations including a small sample size, a short intervention period, and lack of measurement of some related factors. Also, more studies with a suitable prospective design with a larger number of samples, more precise control of physical activity and diet, and increasing the duration of supplementation are necessary to determine the definitive effects of dietary prebiotics and probiotics on T2DM indicators.
Conclusion
Receiving 10 g of inulin powder is significantly related to a decrease in weight, BMI, waist circumference, and hip circumference. However, a significant decrease in DBP was seen in the inulin group. No significant difference was observed in the serum level of MDA and the expression of TLR4, ASC, NLRP3, and caspase1 genes before and after the intervention in both groups.
Competing Interests
The authors declare no conflicts of interest.
Ethical Approval
The study was carried out under the ethical principles outlined in the Declaration of Helsinki. The Tabriz University of Medical Science ethics committee reviewed and approved the study protocol (ethics code: IR.TBZMED.REC.1398.688). Before participation, all subjects were informed about the study’s purpose, procedures, potential risks, and benefits. Written informed consent was obtained from all participants before their inclusion in the study.
Acknowledgements
Authorization to conduct this research was granted by the Nutrition Research Center at Tabriz University of Medical Sciences. We would also like to appreciate the cooperation of the clinical research development unit at Shahid Madani Hospital, Tabriz, Iran, in conducting this research. The authors would also like to thank all of the patients who participated in this study.
References
- Eizirik DL, Mandrup-Poulsen T. A choice of death--the signal-transduction of immune-mediated beta-cell apoptosis. Diabetologia 2001; 44(12):2115-33. doi: 10.1007/s001250100021 [Crossref] [ Google Scholar]
- Gibson GR, Roberfroid MB. Dietary modulation of the human colonic microbiota: introducing the concept of prebiotics. J Nutr 1995; 125(6):1401-12. doi: 10.1093/jn/125.6.1401 [Crossref] [ Google Scholar]
- Zommiti M, Feuilloley MG, Connil N. Update of probiotics in human world: a nonstop source of benefactions till the end of time. Microorganisms 2020; 8(12):1907. doi: 10.3390/microorganisms8121907 [Crossref] [ Google Scholar]
- Ballini A, Charitos IA, Cantore S, Topi S, Bottalico L, Santacroce L. About functional foods: the probiotics and prebiotics state of art. Antibiotics (Basel) 2023; 12(4):635. doi: 10.3390/antibiotics12040635 [Crossref] [ Google Scholar]
- Niness KR. Inulin and oligofructose: what are they?. J Nutr 1999; 129(7 Suppl):1402S-6S. doi: 10.1093/jn/129.7.1402S [Crossref] [ Google Scholar]
- Roberfroid M, Gibson GR, Hoyles L, McCartney AL, Rastall R, Rowland I. Prebiotic effects: metabolic and health benefits. Br J Nutr 2010; 104 Suppl 2:S1-63. doi: 10.1017/s0007114510003363 [Crossref] [ Google Scholar]
- Cani PD, Knauf C, Iglesias MA, Drucker DJ, Delzenne NM, Burcelin R. Improvement of glucose tolerance and hepatic insulin sensitivity by oligofructose requires a functional glucagon-like peptide 1 receptor. Diabetes 2006; 55(5):1484-90. doi: 10.2337/db05-1360 [Crossref] [ Google Scholar]
- Cani PD, Lecourt E, Dewulf EM, Sohet FM, Pachikian BD, Naslain D. Gut microbiota fermentation of prebiotics increases satietogenic and incretin gut peptide production with consequences for appetite sensation and glucose response after a meal. Am J Clin Nutr 2009; 90(5):1236-43. doi: 10.3945/ajcn.2009.28095 [Crossref] [ Google Scholar]
- Genta S, Cabrera W, Habib N, Pons J, Carillo IM, Grau A. Yacon syrup: beneficial effects on obesity and insulin resistance in humans. Clin Nutr 2009; 28(2):182-7. doi: 10.1016/j.clnu.2009.01.013 [Crossref] [ Google Scholar]
- Parnell JA, Reimer RA. Weight loss during oligofructose supplementation is associated with decreased ghrelin and increased peptide YY in overweight and obese adults. Am J Clin Nutr 2009; 89(6):1751-9. doi: 10.3945/ajcn.2009.27465 [Crossref] [ Google Scholar]
- Papadakos SP, Arvanitakis K, Stergiou IE, Lekakis V, Davakis S, Christodoulou MI. The role of TLR4 in the immunotherapy of hepatocellular carcinoma: can we teach an old dog new tricks?. Cancers (Basel) 2023; 15(10):2795. doi: 10.3390/cancers15102795 [Crossref] [ Google Scholar]
- Taha IM, Abdu Allah AM, Abd El Gayed EM. Expression of toll-like receptor 4 and its connection with type 2 diabetes mellitus. Cell Mol Biol (Noisy-le-grand) 2018; 64(13):15-20. [ Google Scholar]
- Yuan J, Yin X, Jiang H. Inhibition of toll-like Receptor-4 expression for amelioration of myocardial injury in diabetes: a meta-analysis. Clinics (Sao Paulo) 2022; 77:100137. doi: 10.1016/j.clinsp.2022.100137 [Crossref] [ Google Scholar]
- Singh K, Singh VK, Agrawal NK, Gupta SK, Singh K. Association of toll-like receptor 4 polymorphisms with diabetic foot ulcers and application of artificial neural network in DFU risk assessment in type 2 diabetes patients. Biomed Res Int 2013; 2013:318686. doi: 10.1155/2013/318686 [Crossref] [ Google Scholar]
- Swanson KV, Deng M, Ting JP. The NLRP3 inflammasome: molecular activation and regulation to therapeutics. Nat Rev Immunol 2019; 19(8):477-89. doi: 10.1038/s41577-019-0165-0 [Crossref] [ Google Scholar]
- Franchi L, Eigenbrod T, Muñoz-Planillo R, Nuñez G. The inflammasome: a caspase-1-activation platform that regulates immune responses and disease pathogenesis. Nat Immunol 2009; 10(3):241-7. doi: 10.1038/ni.1703 [Crossref] [ Google Scholar]
- Gu J, Geng K, Guo M, Huang W, Zhao T, Li X. Targeting pyroptosis: new insights into the treatment of diabetic microvascular complications. Evid Based Complement Alternat Med 2022; 2022:5277673. doi: 10.1155/2022/5277673 [Crossref] [ Google Scholar]
- Mamun AA, Wu Y, Nasrin F, Akter A, Taniya MA, Munir F. Role of pyroptosis in diabetes and its therapeutic implications. J Inflamm Res 2021; 14:2187-206. doi: 10.2147/jir.S291453 [Crossref] [ Google Scholar]
- Mangan MS, Olhava EJ, Roush WR, Seidel HM, Glick GD, Latz E. Targeting the NLRP3 inflammasome in inflammatory diseases. Nat Rev Drug Discov 2018; 17(8):588-606. doi: 10.1038/nrd.2018.97 [Crossref] [ Google Scholar]
- Stehlik C, Fiorentino L, Dorfleutner A, Bruey JM, Ariza EM, Sagara J. The PAAD/PYRIN-family protein ASC is a dual regulator of a conserved step in nuclear factor kappaB activation pathways. J Exp Med 2002; 196(12):1605-15. doi: 10.1084/jem.20021552 [Crossref] [ Google Scholar]
- Zhou J, Yan S, Guo X, Gao Y, Chen S, Li X. Salidroside protects pancreatic β-cells against pyroptosis by regulating the NLRP3/GSDMD pathway in diabetic conditions. Int Immunopharmacol 2023; 114:109543. doi: 10.1016/j.intimp.2022.109543 [Crossref] [ Google Scholar]
- Zhong C, Xie Y, Wang H, Chen W, Yang Z, Zhang L. Berberine inhibits NLRP3 inflammasome activation by regulating mTOR/mtROS axis to alleviate diabetic cardiomyopathy. Eur J Pharmacol 2024; 964:176253. doi: 10.1016/j.ejphar.2023.176253 [Crossref] [ Google Scholar]
- Dai Y, Zhou J, Shi C. Inflammasome: structure, biological functions, and therapeutic targets. MedComm (2020) 2023; 4(5):e391. doi: 10.1002/mco2.391 [Crossref] [ Google Scholar]
- Bryan NB, Dorfleutner A, Rojanasakul Y, Stehlik C. Activation of inflammasomes requires intracellular redistribution of the apoptotic speck-like protein containing a caspase recruitment domain. J Immunol 2009; 182(5):3173-82. doi: 10.4049/jimmunol.0802367 [Crossref] [ Google Scholar]
- Franchi L, Muñoz-Planillo R, Núñez G. Sensing and reacting to microbes through the inflammasomes. Nat Immunol 2012; 13(4):325-32. doi: 10.1038/ni.2231 [Crossref] [ Google Scholar]
- Lamkanfi M, Kanneganti TD. NLRP3: an immune sensor of cellular stress and infection. Int J Biochem Cell Biol 2010; 42(6):792-5. doi: 10.1016/j.biocel.2010.01.008 [Crossref] [ Google Scholar]
- Wang C, Pan Y, Zhang QY, Wang FM, Kong LD. Quercetin and allopurinol ameliorate kidney injury in STZ-treated rats with regulation of renal NLRP3 inflammasome activation and lipid accumulation. PLoS One 2012; 7(6):e38285. doi: 10.1371/journal.pone.0038285 [Crossref] [ Google Scholar]
- Bauernfeind FG, Horvath G, Stutz A, Alnemri ES, MacDonald K, Speert D. Cutting edge: NF-kappaB activating pattern recognition and cytokine receptors license NLRP3 inflammasome activation by regulating NLRP3 expression. J Immunol 2009; 183(2):787-91. doi: 10.4049/jimmunol.0901363 [Crossref] [ Google Scholar]
- Yu W, Wu J, Cai F, Xiang J, Zha W, Fan D. Curcumin alleviates diabetic cardiomyopathy in experimental diabetic rats. PLoS One 2012; 7(12):e52013. doi: 10.1371/journal.pone.0052013 [Crossref] [ Google Scholar]
- Dehghan P, Pourghassem Gargari B, Asgharijafarabadi M. Effects of high-performance inulin supplementation on glycemic status and lipid profile in women with type 2 diabetes: a randomized, placebo-controlled clinical trial. Health Promot Perspect 2013; 3(1):55-63. doi: 10.5681/hpp.2013.007 [Crossref] [ Google Scholar]
- Rao M, Gao C, Xu L, Jiang L, Zhu J, Chen G. Effect of inulin-type carbohydrates on insulin resistance in patients with type 2 diabetes and obesity: a systematic review and meta-analysis. J Diabetes Res 2019; 2019:5101423. doi: 10.1155/2019/5101423 [Crossref] [ Google Scholar]
- Becerril-Alarcón Y, Campos-Gómez S, Valdez-Andrade JJ, Campos-Gómez KA, Reyes-Barretero DY, Benítez-Arciniega AD. Inulin supplementation reduces systolic blood pressure in women with breast cancer undergoing neoadjuvant chemotherapy. Cardiovasc Ther 2019; 2019:5707150. doi: 10.1155/2019/5707150 [Crossref] [ Google Scholar]
- Beretta MV, Bernaud FR, Nascimento C, Steemburgo T, Rodrigues TC. Higher fiber intake is associated with lower blood pressure levels in patients with type 1 diabetes. Arch Endocrinol Metab 2018; 62(1):47-54. doi: 10.20945/2359-3997000000008 [Crossref] [ Google Scholar]
- Miyamoto J, Kasubuchi M, Nakajima A, Irie J, Itoh H, Kimura I. The role of short-chain fatty acid on blood pressure regulation. Curr Opin Nephrol Hypertens 2016; 25(5):379-83. doi: 10.1097/mnh.0000000000000246 [Crossref] [ Google Scholar]
- Pluznick JL. Microbial short-chain fatty acids and blood pressure regulation. Curr Hypertens Rep 2017; 19(4):25. doi: 10.1007/s11906-017-0722-5 [Crossref] [ Google Scholar]
- Roshanravan N, Mahdavi R, Alizadeh E, Asghari Jafarabadi M, Hedayati M, Ghavami A. Effect of butyrate and inulin supplementation on glycemic status, lipid profile and glucagon-like peptide 1 level in patients with type 2 diabetes: a randomized double-blind, placebo-controlled trial. Horm Metab Res 2017; 49(11):886-91. doi: 10.1055/s-0043-119089 [Crossref] [ Google Scholar]
- Salmean YA. Acute fiber supplementation with inulin-type fructans curbs appetite sensations: a randomized, double-blind, placebo-controlled study. Food Nutr Res 2017; 61(1):1341808. doi: 10.1080/16546628.2017.1341808 [Crossref] [ Google Scholar]
- Jackson KG, Taylor GR, Clohessy AM, Williams CM. The effect of the daily intake of inulin on fasting lipid, insulin and glucose concentrations in middle-aged men and women. Br J Nutr 1999; 82(1):23-30. doi: 10.1017/s0007114599001087 [Crossref] [ Google Scholar]
- Russo F, Riezzo G, Chiloiro M, De Michele G, Chimienti G, Marconi E. Metabolic effects of a diet with inulin-enriched pasta in healthy young volunteers. Curr Pharm Des 2010; 16(7):825-31. doi: 10.2174/138161210790883570 [Crossref] [ Google Scholar]
- Visuthranukul C, Chamni S, Kwanbunbumpen T, Saengpanit P, Chongpison Y, Tepaamorndech S. Effects of inulin supplementation on body composition and metabolic outcomes in children with obesity. Sci Rep 2022; 12(1):13014. doi: 10.1038/s41598-022-17220-0 [Crossref] [ Google Scholar]
- Zhang W, Tang Y, Huang J, Yang Y, Yang Q, Hu H. Efficacy of inulin supplementation in improving insulin control, HbA1c and HOMA-IR in patients with type 2 diabetes: a systematic review and meta-analysis of randomized controlled trials. J Clin Biochem Nutr 2020; 66(3):176-83. doi: 10.3164/jcbn.19-103 [Crossref] [ Google Scholar]
- Liu Y, Wang J, Wu C. Modulation of gut microbiota and immune system by probiotics, pre-biotics, and post-biotics. Front Nutr 2021; 8:634897. doi: 10.3389/fnut.2021.634897 [Crossref] [ Google Scholar]
-
Song J, Li Q, Everaert N, Liu R, Zheng M, Zhao G, et al. Effects of inulin supplementation on intestinal barrier function and immunity in specific pathogen-free chickens with Salmonella infection. J Anim Sci 2020;98(1). doi: 10.1093/jas/skz396.
- Kasti AN, Synodinou KD, Pyrousis IA, Nikolaki MD, Triantafyllou KD. Probiotics regulating inflammation via NLRP3 inflammasome modulation: a potential therapeutic approach for COVID-19. Microorganisms 2021; 9(11):2376. doi: 10.3390/microorganisms9112376 [Crossref] [ Google Scholar]
- Song J, Li Q, Everaert N, Liu R, Zheng M, Zhao G. Dietary inulin supplementation modulates short-chain fatty acid levels and cecum microbiota composition and function in chickens infected with Salmonella. Front Microbiol 2020; 11:584380. doi: 10.3389/fmicb.2020.584380 [Crossref] [ Google Scholar]
- Bao T, He F, Zhang X, Zhu L, Wang Z, Lu H. Inulin exerts beneficial effects on non-alcoholic fatty liver disease via modulating gut microbiome and suppressing the lipopolysaccharide-toll-like receptor 4-Mψ-nuclear factor-κB-nod-like receptor protein 3 pathway via gut-liver axis in mice. Front Pharmacol 2020; 11:558525. doi: 10.3389/fphar.2020.558525 [Crossref] [ Google Scholar]
- Roshanravan N, Mesri Alamdari N, Asghari Jafarabadi M, Mohammadi A, Rostamzadeh Shabestari B, Nasirzadeh N. Effects of oral butyrate and inulin supplementation on inflammation-induced pyroptosis pathway in type 2 diabetes: a randomized, double-blind, placebo-controlled trial. Cytokine 2020; 131:155101. doi: 10.1016/j.cyto.2020.155101 [Crossref] [ Google Scholar]
- Singh V, Yeoh BS, Walker RE, Xiao X, Saha P, Golonka RM. Microbiota fermentation-NLRP3 axis shapes the impact of dietary fibres on intestinal inflammation. Gut 2019; 68(10):1801-12. doi: 10.1136/gutjnl-2018-316250 [Crossref] [ Google Scholar]
- Chen H, Zhang X, Liao N, Mi L, Peng Y, Liu B. Enhanced expression of NLRP3 inflammasome-related inflammation in diabetic retinopathy. Invest Ophthalmol Vis Sci 2018; 59(2):978-85. doi: 10.1167/iovs.17-22816 [Crossref] [ Google Scholar]