Biomed adv. 2(2):52-60.
doi: 10.34172/bma.20
Systematic Review
Cell-free DNA as a diagnostic method in patients with neuroblastoma: A systematic review
Mehdi Mohebalizadeh Conceptualization, Visualization, Writing – review & editing, 1 
Tooba Mohammadi Investigation, Methodology, 1
Somayeh Abolhasani Methodology, 1, 2
Zahra Asadi Investigation, 1
Maryam Kahyaei-Aghdam Validation, 1
Negin Mahboubi Validation, 1
Rahim Asghari Writing – review & editing, 3, 4
Vahid Shafiei-Irannejad Supervision, Writing – review & editing, 5, *
Shahriar Alipour Conceptualization, Supervision, Visualization, Writing – review & editing, 5, 6, *
Author information:
1Student Research Committee, Urmia University of Medical Sciences, Urmia, Iran
2Department of Biochemistry, Faculty of Medicine, Urmia University of Medical Sciences, Urmia, Iran
3Hematology, Immune Cell Therapy, and Stem Cell Transplantation Research Center, Clinical Research Institute, Urmia University of Medical Sciences, Urmia, Iran
4Department of Internal Medicine, School of Medicine, Urmia University of Medical Sciences, Urmia, Iran
5Cellular and Molecular Research Center, Cellular and Molecular Medicine Research Institute, Urmia University of Medical Sciences, Urmia, Iran
6Department of Clinical Biochemistry and Applied Cell Sciences, Urmia University of Medical Sciences, Urmia, Iran
Abstract
Summary
This systematic review aims to summarize circulating cell-free DNA (cfDNA) levels and their detection methods for early detection of neuroblastoma with less invasive procedures. After determining the search keywords, including neuroblastoma and cfDNA, these words were searched using MeSH and free keywords in databases. Our results also showed that the diagnostic methods, the time of isolation protocols, and sampling techniques were different in all studies based on extraction kits. The qPCR method was the most used in detecting the gene segments. Samples were obtained from peripheral blood and bone marrow. MYCN amplification was the most seen genetic alteration; ALK, NSE/ (LINE-1), RET, RASSF1A, and APC mutations were often observed. On the clinical scale, patients with higher levels of cfDNA were prone to progressed stages or recurrence of the disease in recovered patients, as some studies have shown that people with recent neuroblastoma had higher levels of cfDNA than those with long-term disease. In conclusion, cfDNA amplification can be a concern in neuroblastoma. It was additionally found that cfDNA ranges in several studies were related to the disorder stage, as some have proven that people with the latest neuroblastoma had higher ranges of cfDNA than those with long-term disease.
Keywords: Cell-free nucleic acids, Neuroblastoma, Polymerase chain reaction, MYCN
Copyright and License Information
© 2025 The Author(s).
This is an open-access article distributed under the terms of the Creative Commons Attribution License (
http://creativecommons.org/licenses/by/4.0/), which permits unrestricted use, distribution, and reproduction in any medium, provided the original work is properly cited.
Funding Statement
None.
Introduction
Neuroblastoma (NB) is the most common extracranial solid tumor arising from the sympathetic nervous system. NB usually occurs in children with a median age of seventeen months and accounts for 15% of cancer-related deaths in children.1,2 Clinical manifestations range from asymptomatic to mass compression symptoms depending on the location.3 Tumor behavior varies from spontaneous regression to metastasis or death. NB usually occurs non-inherited, while mutations in ALK and PHOX2B germline genes are often seen in familial NB.4-6 Amplification of MYCN oncogene occurs in 18-38% of cases and is related to poor prognosis.4
Patients with MYCN-amplified neuroblastoma often require more intensive treatment, consisting of high-dose chemotherapy and stem cell transplantation. They have a poorer ordinary survival rate than sufferers without MYCN amplification.7 The mechanisms via which MYCN amplification promotes tumor increase and progression are nonetheless being investigated; however, it is a concept that involves the dysregulation of several cell pathways that manage cell proliferation, apoptosis, and differentiation. MYCN amplification has additionally been related to the downregulation of genes involved in neuronal differentiation, which may contribute to the aggressive nature of MYCN-amplified tumors.8
As NB is suspected, laboratory tests (complete blood count, organ-based function tests, ferritin, and lactate dehydrogenase), imaging, and pathological studies are required to confirm the diagnosis and staging.9 Urinary catecholamines were used to measure screening, but they could not lower the mortality rate.10 Molecular assessment of the tumor is becoming more noticeable for evaluating the prognosis. MYCN gene amplification is an important marker, which is measured by fluorescence in situ hybridization (FISH),11 cell ploidy (diploid, triploid, and hyperploid) by flow cytometry,12 and common segmental chromosomal alterations by array comparative genomic hybridization.13
In comparison, a biopsy makes a definite tumor diagnosis.14 The associated factors with poor prognosis include older age of onset, high levels of serum ferritin and lactate dehydrogenase, less maturation of tumor cells in the pathological examination, cell diploidy, high amplification of MYCN, and segmental chromosomal alterations (17q gain, loss of 11q, and loss of 1p).9
Circulating cell-free DNA (cfDNA) are the nucleic acid fragments of the genome that circulate extracellularly in the bloodstream through active secretion, apoptosis, and necrosis. The amount of cfDNA in healthy people is less than 10 ng/mL of plasma but rises in some clinical issues such as trauma, stroke, myocardial infarction, and chronic health problems, including diabetes and malignancies.15,16 The cfDNA can be produced by tumor cells and non-tumor cells growing around tumor tissue.17 The cfDNA has progressively been used as a diagnostic and predictive marker in cancer.18
The size of cfDNA as a biomarker for tumor stage, progression, and recurrence is a promising method that has proven particular success in countless tumor entities.
In colorectal cancer, cfDNA has been proven to be a promising biomarker for monitoring disorder progression and detecting early relapse. Studies have demonstrated that changes in the amount of cfDNA over time can be used to predict disease recurrence and survival. cfDNA analysis is a promising tool for diagnosing, prognosis, and monitoring NSCLC. In breast cancer, cfDNA evaluation has shown promise as a biomarker for predicting response to cure and monitoring cancer progression. Studies have established that modifications in the amount of cfDNA over time can be used to predict sickness recurrence and survival.7,19
Measuring cfDNA as a biomarker for tumor stage, progression, and recurrence has proven precise success.20 Obtaining a surgical or core needle biopsy is necessary to assess the solid tumors’ molecular profile. It is invasive, takes only a blind sample for heterogeneity, and makes it difficult to repeat the biopsy. The genome pattern of cfDNA matches closely with the corresponding tumors.21 They can be essential biomarkers in diagnosing cancers, prenatal problems, and early detection of transplant rejection.22-24 Increased serum cfDNA levels may be due to decreased serum DNAse I and II enzyme activity. Decreased enzymatic activity may result from an inhibitor secreted by the tumor.25 Besides, these tumor-derived genetic components in the blood can indicate tumor cells’ presence and response rate to treatment.26 Establishing the droplet digital polymerase chain reaction (ddPCR) to assess MYCN and ALK amplifications using liquid biopsies can help to find less invasive and early diagnostic methods.27,28
For example, to identify gene sequences (MYCN amplification), Southern blotting and FISH are used in the neuroblastoma tumor tissue itself. Southern blot is a method with a long duration (1 to 2 weeks), is sensitive to DNA damage, and requires high amounts of tumor DNA. Limiting factors for PCR and Southern blot, such as the diluting factor of healthy cells, can be overcome using more touchy strategies such as digital PCR (dPCR) or next-generation sequencing (NGS). FISH visualizes unique DNA sequences in human cells. While FISH can be useful for detecting genetic aberrations in cancer cells, it has numerous limitations. One is that it is no longer as touchy as PCR-based methods or NGS for detecting low degrees of cfDNA. In addition, FISH requires fluorescent probes, which can be steeply priced and time-consuming to strengthen and optimize. The advantages of the FISH method include the ability to examine individual cells and the diluting effects of normal cells in the study of copy genes, including MYCN, which are considered limiting factors in Southern blot and PCR methods.29 The FISH method is the gold standard for assessing gene doses in cancer specimens by evaluating images and large cell populations with fluorescence microscopy by specialists.30 However, for peripheral blood samples, the PCR method is used. The PCR method reduces the time to several hours. It is used in the early detection of NB and other malignancies such as lung cancer (e.g., mutation and heterozygosity of the p53 gene and evaluation of serum DNA).31 Other used methods are probe amplification (Multiplex ligation-dependent probe amplification: MLPA) and genomic hybridization (aCGH) comparative array obtained through tumor biopsy. Biopsy procedures are required for invasive tissue analysis, and tumors are not always available for genetic analysis. A mistake in preparing a biopsy can increase the number of non-malignant cells. If the exact tumor sample is not biopsied during the biopsy, it is likely to be taken from non-tumor samples. So, the analysis will need to be corrected. Therefore, using the PCR gene detection method in serum and plasma is faster, less expensive, and less risky.30 cfDNA sequences commonly refer to specific regions of the cfDNA molecule that include genetic information. These areas can pick out precise genomic alterations, such as mutations, reproduction number variations, or translocations associated with cancer. Because cancer cells shed DNA into the bloodstream, the detection of unique genomic changes in cfDNA can furnish statistics about the presence and traits of cancer cells in a non-invasive manner.
This systematic review summarizes cfDNA sequences and detection methods for earlier diagnosis of neuroblastoma using less invasive procedures.
Methods
Search strategy
After determining the keywords, including neuroblastoma and cfDNA, these words were searched using MeSH and free keywords in Medline, Scopus, Web of Science, and Cochrane Library databases. As well as to find information in Farsi databases (with English language articles) such as Iranmedex, SID, IranDoc, and Magiran also were searched.
For this purpose, the desired keywords were searched in a combination of the following types of models in the mentioned databases (PICO):
-
P: Neuroblastomas OR neuroblastoma
-
I: Cell-Free Nucleic Acids OR Cell-Free Nucleic Acids OR Nucleic Acids, Cell-Free OR Circulating Cell-Free Nucleic Acids OR Circulating Cell-Free Nucleic Acids OR Circulating Nucleic Acids OR Acids, Circulating Nucleic OR Nucleic Acids, Circulating OR Cell-Free Nucleic Acid OR Cell-Free Nucleic Acid OR Nucleic Acid, Cell-Free OR Cell-Free DNA OR Cell-Free DNA OR DNA, Cell-Free OR fDNA OR cirDNA OR Cell-Free Deoxyribonucleic Acid OR Acid, Cell-Free Deoxyribonucleic OR Cell Free Deoxyribonucleic Acid OR Deoxyribonucleic Acid, Cell-Free OR Circulating DNA OR DNA, Circulating.
-
O: Diagnosis OR early diagnosis OR diagnosis, early OR detection
Papers and documents obtained from the search were screened in several stages as title, abstract, and full text, and those studies that met the inclusion criteria were selected. Two experts evaluated the studies and used a checklist regarding types of bias risk (selection, performance, report, attrition, etc.) and excluded content and low-quality studies. A third person was used for selection and evaluation in case of expert disagreement, and a group discussion was held. Relevant data were then extracted from the studies using a designed table.
Inclusion and exclusion criteria
All articles were searched by January 2023. Studies were included if they met the following inclusion criteria:
-
Published by January 20, 2023.
-
Focused on neuroblastoma, with diagnostic methods based on cfDNA and related genes.
-
Original research articles (not reviews or duplicates).
-
Contained sufficient information, including the type of intervention and cfDNA assay method.
The exclusion criteria were:
-
Articles with mismatched keywords in the title or abstract during the screening stage.
-
Review articles or duplicate studies.
-
Studies unrelated to neuroblastoma, or lacking information on cfDNA detection methods or related genes.
-
Studies involving non-human species (e.g., mice).
-
Systematic reviews and meta-analyses.
As mentioned, content, in the first stage after the initial search, the number of articles was about 324, of which 61 were duplicates and were left out (263 remaining). Finally, according to the mentioned criteria, only 17 related articles were reviewed (Figure 1).
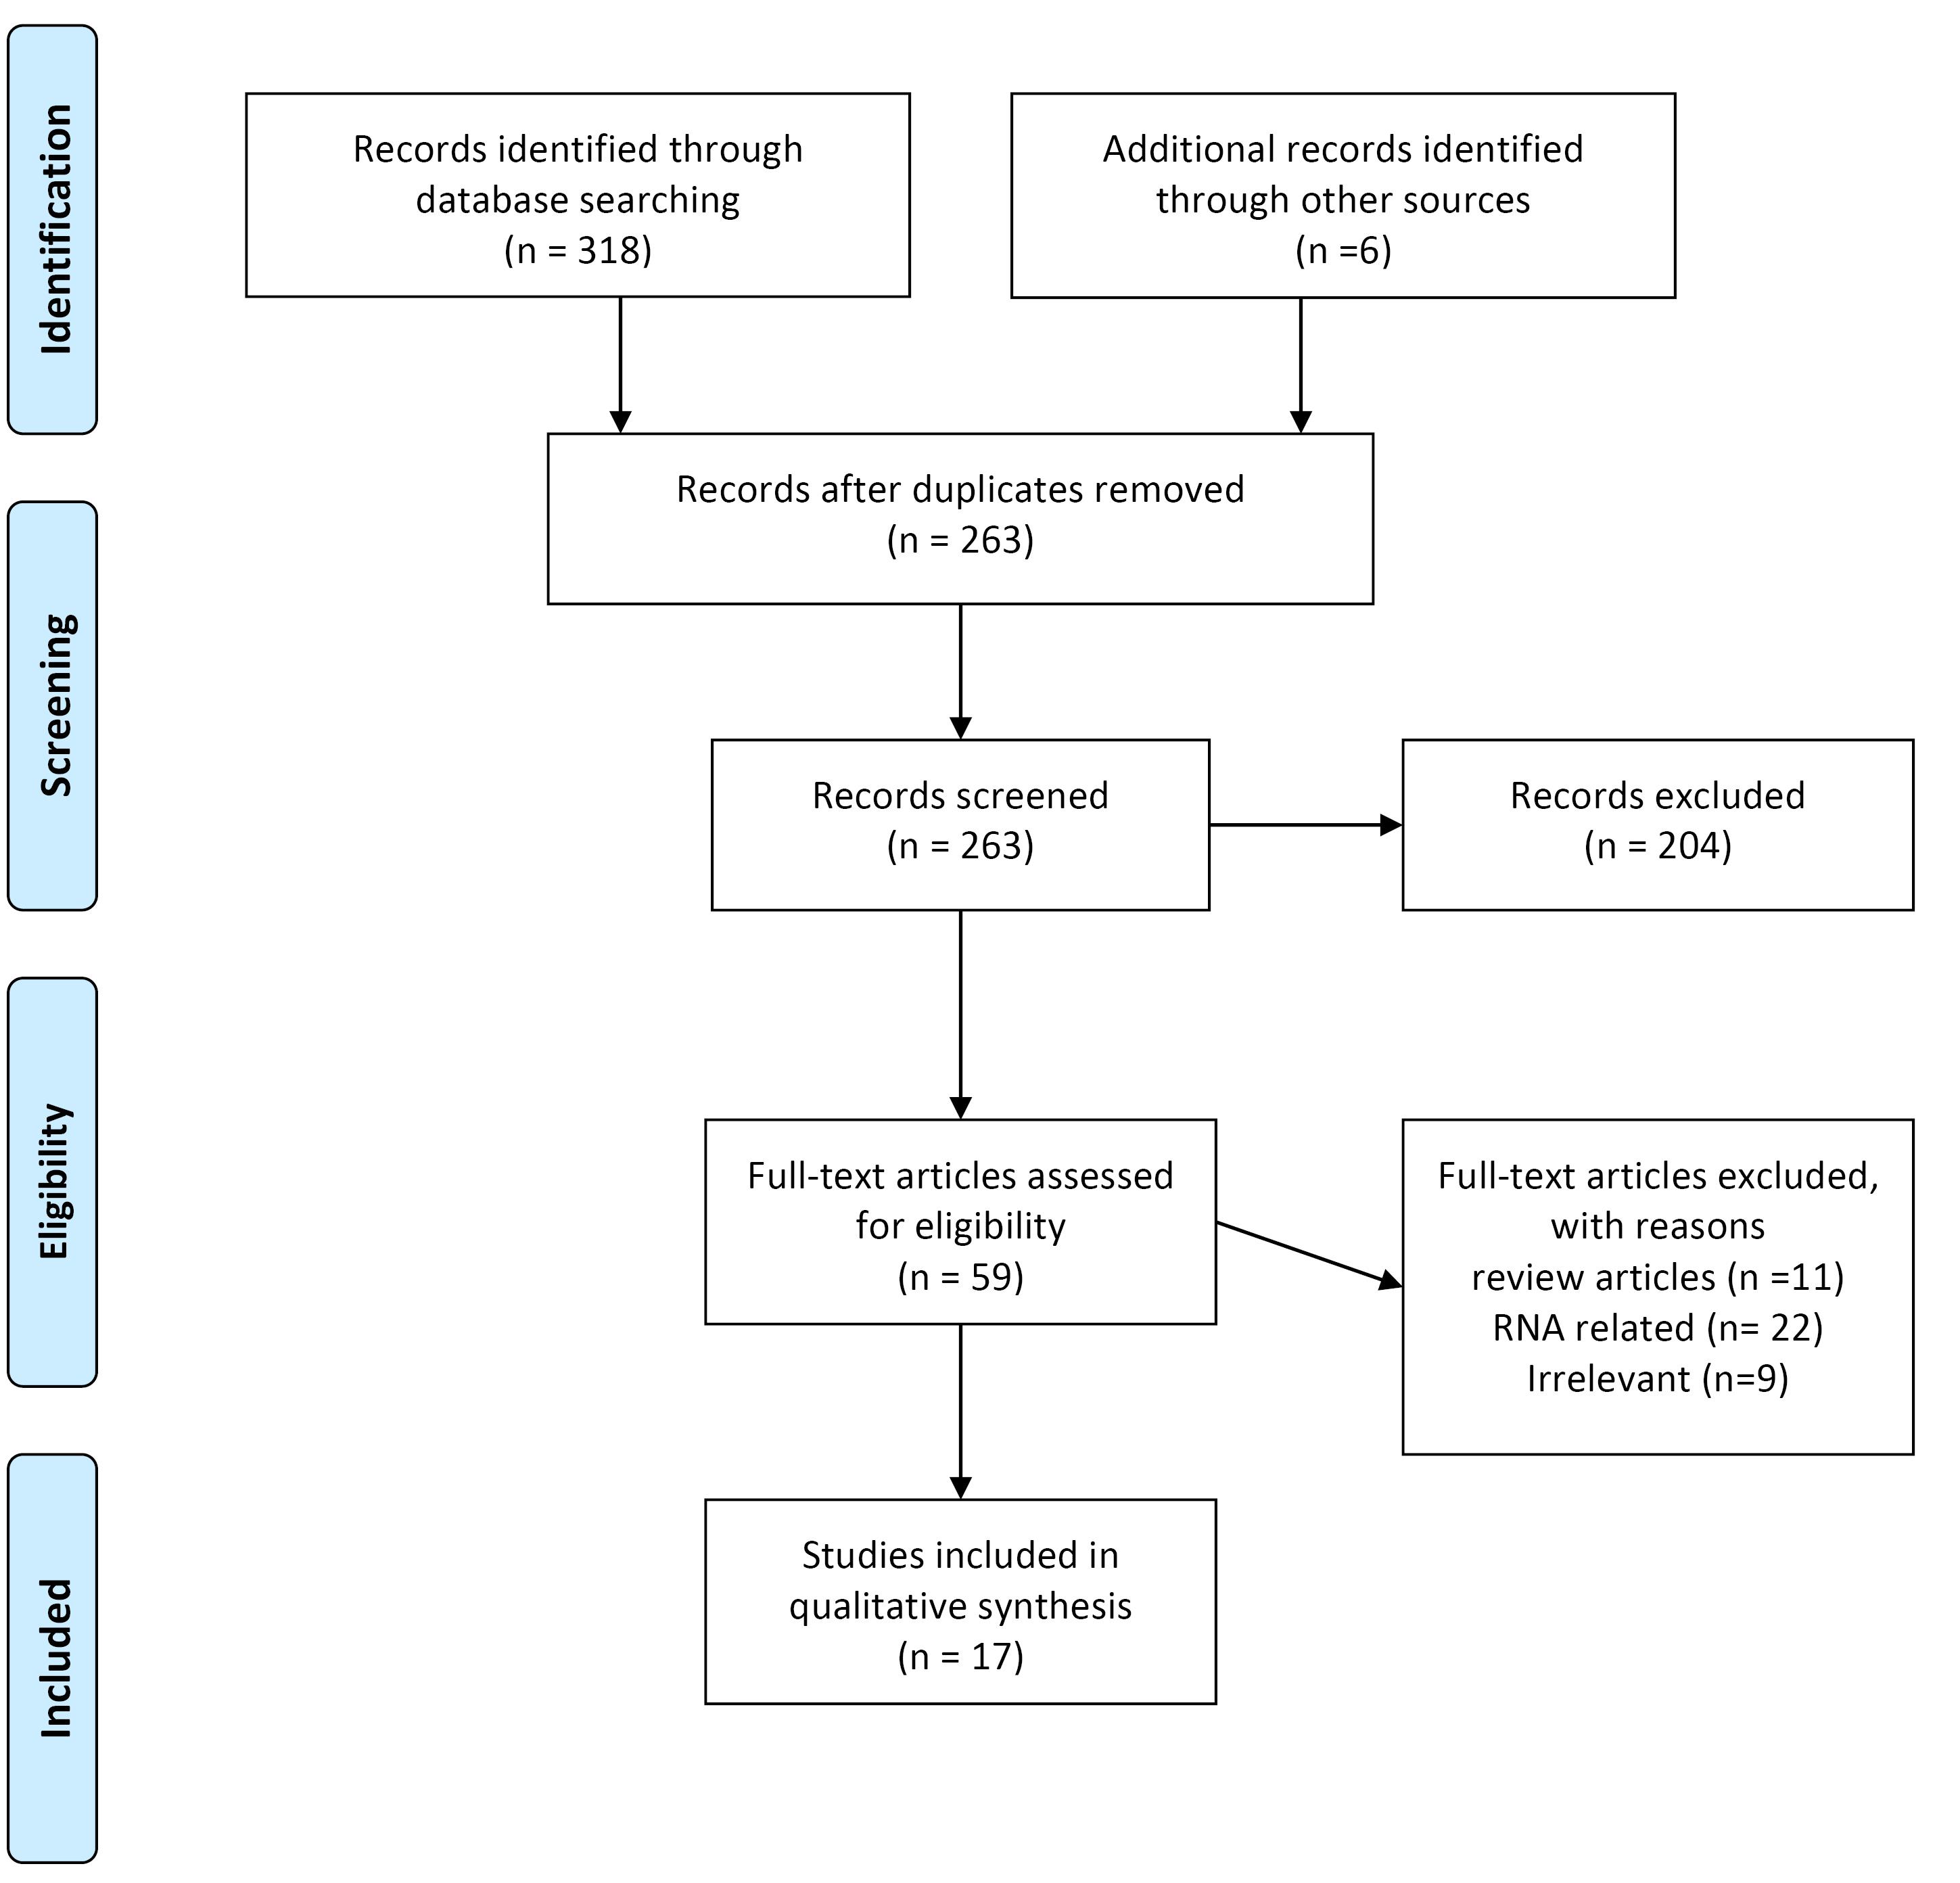
Figure 1.
Flow diagram of the literature search and study selection process
.
Flow diagram of the literature search and study selection process
Flowchart of the search strategy
As shown in Figure 1, the initial search results showed more than 318 articles, but in the end, 17 articles were selected for systematic review.
Data extraction
The studies were sorted by publication date after identifying the final articles. Before extracting the data, the tables required for this study were designed based on the required criteria as the Extraction Table in the Excel software environment. The required data were then extracted from selected articles based on pre-prepared tables. These data include general data of articles (names of first authors of articles, name of the journal, name of the country of study, year of study), data related to method (type of study, duration of study, purpose of study, type of intervention, type of kit and Sample type) intervention and response data (genes involved, genetic and epigenetic changes, association with tumor samples). Finally, if there was a disagreement between the data, it was discussed until the same result was reached. This study was conducted in the Student Research Committee of Urmia University of Medical Sciences.
Quality measurement
We measured the value of the involved studies using the Cochrane Collaboration tool for measuring the risk of bias.32 In this reading, selected studies were judged based on the following criteria:
Bias related to patient selection (“selection bias”) is determined based on the complete description of inclusion and exclusion criteria. If patients are carefully selected, they will be considered low-risk. “Measurement bias,” which in this study is correlated to methods of measuring cfDNA levels and scores related to the cfDNA detection method. If precise methods are used, the risk is considered low. “Lead time bias” refers to the length of the follow-up period. If it is revealed in full detail, the risk is low regarding bias. “Exposure bias” was considered as genetic and epigenetic changes in genes correlated in NB patients. Finally, “confounding bias” relates to the data analysis and results. If confounding factors such as gender, age, disease stage, and drug use are carefully observed during the analysis of cfDNA levels and other factors correlated to genetic alterations, that study is considered low risk in confounding bias.
Results
Included studies
A total of318 possible studies were first searched, and six records from another search of other sources were added (n = 324). Following eligibility screening by title and abstract, 259 studies were eliminated. The excluded studies were also duplicated, reviews, non-human studies, unrelated studies on cfDNA, and non-related to neuroblastoma. Of the remaining 59 studies, the full texts were screened, and 42 were excluded because they were RNA-related studies and irrelevant studies (absence of prognosis information, comments, and improperly grouped mutations). Finally, 17 studies met the inclusion criteria and were included for descriptive summarization (Table 1).
Table 1.
Characteristics of studies included in the systematic review
|
ID |
Author (year)
|
Country
|
Sample size
|
Source of cfDNA
|
Study type
|
Diagnostic technique
|
Genes
|
Abnormality
|
Ref
|
| 1 |
Kurihara et al
(2015) |
Japan |
44 |
Plasma |
Cross-sectional |
NGS, dPCR, FISH |
ALK
RET |
ALK and RET mutations |
33
|
| 2 |
Combaret et al (2002) |
France |
102 |
Plasma |
Case-control |
PCR amplification |
MYCN |
unclear |
34
|
| 3 |
Ma et al (2016) |
Korea |
105 |
Serum |
Cross-sectional |
Qualitative PCR |
MYCN |
High LDH and NSE |
35
|
| 4 |
Combaret et al (2011) |
- |
142 |
Serum and plasma |
Cross-sectional |
quantitative real-time PCR, MLPA |
MYCN |
17q gain determination
in cfDNA |
36
|
| 5 |
Chicard et al (2017) |
France |
19 |
Plasma |
Case-series |
Whole-genome/exome sequenced |
1) Genes of the MAPK pathway
2) Ubiquitin
protein ligase HERC2 |
SNVs |
37
|
| 6 |
Van Roy et al (2017) |
Belgium |
37 |
Plasma |
Cohort |
FISH, MLPA, array CGH, and SNP array |
MYCN and LIN28B |
MYCN and LIN28B amplification and ATRX deletion |
38
|
| 7 |
Wang et al (2018) |
China |
79 |
Peripheral
blood |
Cross-sectional |
qPCR /QIAamp kits |
NSE/(LINE-1) |
Increase NSE, LDH and cfDNA levels |
39
|
| 8 |
Liu et al (2018) |
China |
28 |
Peripheral
blood |
Cross-sectional |
The EpCAM method combined with FISH |
MYCN/ NSE |
chromosome 8 hyper diploid |
40
|
| 9 |
Su et al (2019) |
China |
58 |
Plasma |
Cross-sectional |
QIAamp DNA Micro Kit |
MYCN |
cfDNA, NSE, and LDH levels were down-regulated |
26
|
| 10 |
Chicard et al (2016) |
France |
70 |
Plasma |
Case-control |
Genomic profile in aCGH |
MYCN, TERT, IGF1R |
unclear |
41
|
| 11 |
Su et al (2020) |
China |
116 |
Venous blood samples |
Cross-sectional |
QIAmp DNA Blood Mini Kits qPCR |
MYCN, NSE, LDH |
unclear |
42
|
| 12 |
Merugu et al (2020) |
UK |
40 |
Blood and bone marrow |
Case-control |
QIAmp DNA
Blood Mini Kits |
MYCN |
low frequency of hyperploidy |
43
|
| 13 |
van Zogchel et al (2020) |
Netherlands |
56 |
Plasma |
Cross-sectional |
qPCR |
RASSF1A |
hypermethylated RASSF1A |
44
|
| 14 |
Peitz et al (2020) |
Germany |
9 |
Plasma |
Cross-sectional |
ddPCR |
MYCN, ALK |
MYCN amplification,
ALK mutations or amplifications |
45
|
| 15 |
Van Paemel et al (2020) |
Belgium |
10 |
Plasma and cerebrospinal fluid |
Cross-sectional |
cf-RRBS |
MYCN |
MYCN amplification,
cfDNA methylation profile |
46
|
| 16 |
Kahana-Edwin et al (2021) |
Australia |
29 |
Blood |
Clinical Trial |
Blood samples collected in Streck, PAXgene |
MNA, MYCN, ALK, and THNSL2 |
MYCN amplification |
47
|
| 17 |
Lodrini et al (2022) |
Germany |
31 |
Blood plasma, bone marrow plasma, and CSF |
Cross-Sectional |
Qiagen
Puregene Core kit A (Qiagen) or the QIAamp DNA Mini kit (Qiagen) |
MYCN and ALK |
heterogeneity for cell clones harboring MYCN amplifications and druggable ALK alterations |
48
|
NGS, next-generation sequencing; dPCR, digital PCR; FISH, fluorescence in situ hybridization; MLPA, Multiplex ligation-dependent probe amplification; ddPCR, droplet digital PCR; cf-RRBS, cell-free reduced representation bisulphite sequencing; CSF, cerebrospinal fluid; SNVs, Single nucleotide variants.
Study characteristics
The included studies, published between 2002 and 2022, analyzed the relationship between cfDNA status and survival outcomes in 926 patients. The number of patients in each study ranged from 19 to 142. Eleven were cross-sectional studies, three studies were case-control studies, and the other was one case series, one cohort study and one clinical trial. These studies have been published in the full paper in reliable journals. These studies were published in the English language. Also, these studies were related to Asia and Europe. They were in China, Japan, Korea, France, the United Kingdom, and Belgium, where the most significant share was related to China and France, with seven studies.
The study characteristics of the patients enrolled in these studies are summarized in Table 1. We measured the risk of bias using the Cochrane Collaboration tool for measuring the risk of bias. We classified bias according to five domains: sample selection bias, cfDNA extraction bias, follow-up bias, exposure (genetic/epigenetic alterations) bias, and confounding (correlation) bias. We defined the risk of bias as “low, high, unclear risk.” In most studies we reviewed, the inclusion and exclusion criteria were not mentioned, and most were in the unclear group. Most studies carefully mentioned the cfDNA isolation method, diagnostic technique, and sampling timings. Therefore, these options were placed in the low-risk bias group.
The studies also showed that patients’ follow-up ranges and lengths must be clarified. Because of this, they could have been at more evident or higher risk regarding follow-up. Most studies entirely focused on genetic and epigenetic changes (exposure bias). Therefore, the bias of this option was considered low risk. Finally, this study evaluated articles to determine the relationship between cfDNA levels and disease progression, disease stage, and patient age. Most of them reported and had low-risk bias (confounding bias).
The risk of bias for each included study is summarized in Table 2, while the distribution of individual risk of bias characteristics, expressed as a percentage across all included studies, and is illustrated in Figure 2.
Table 2.
The risk of bias assessment of the included studies
|
Author (year)
|
Patient selection bias (inclusion and exclusion)
|
cfDNA extraction bias (methods)
|
Follow-up bias
|
Exposure bias (genetic/epigenetic alterations)
|
Confounding bias (correlation)
|
| Kurihara et al (2015)33 |
High risk |
Low risk |
High |
Low |
Low |
| Combaret et al (2002)34 |
Unclear |
Low risk |
High |
High |
Low risk |
| Ma et al (2016)35 |
High |
Low risk |
Unclear |
Low |
Low risk |
| Combaret et al (2018)36 |
Unclear |
Low risk |
Low |
Low |
Low |
| Chicard et al (2017)37 |
Unclear |
Low risk |
Low |
Unclear |
Low |
| Van Roy et al (2017)38 |
Unclear |
Low |
Unclear |
Low |
Low |
| Wang et al (2018)39 |
Low |
Unclear |
Low |
Low |
Low |
| Liu et al (2018)40 |
Unclear |
High |
low |
low |
low |
| Su et al (2019)26 |
Low |
Low |
Unclear |
Low |
Low |
| Chicard et al (2016)41 |
Unclear |
Low |
Unclear |
Unclear |
Low |
| Su et al (2020)42 |
Low |
Low |
High |
Low |
Low |
| Merugu et al (2020)43 |
Unclear |
Low |
Unclear |
Low |
High |
| van Zogchel et al (2020)44 |
High |
Low |
Low |
Low |
Unclear |
| Peitz et al (2020)45 |
Unclear |
Low |
Unclear |
Low |
Low |
| Van Paemel et al (2020)46 |
Unclear |
High |
Unclear |
High |
High |
| Kahana-Edwin et al (2021)47 |
High |
High |
Unclear |
High |
Low |
| Lodrini et al (2022)48 |
Unclear |
High |
Low |
High |
High |
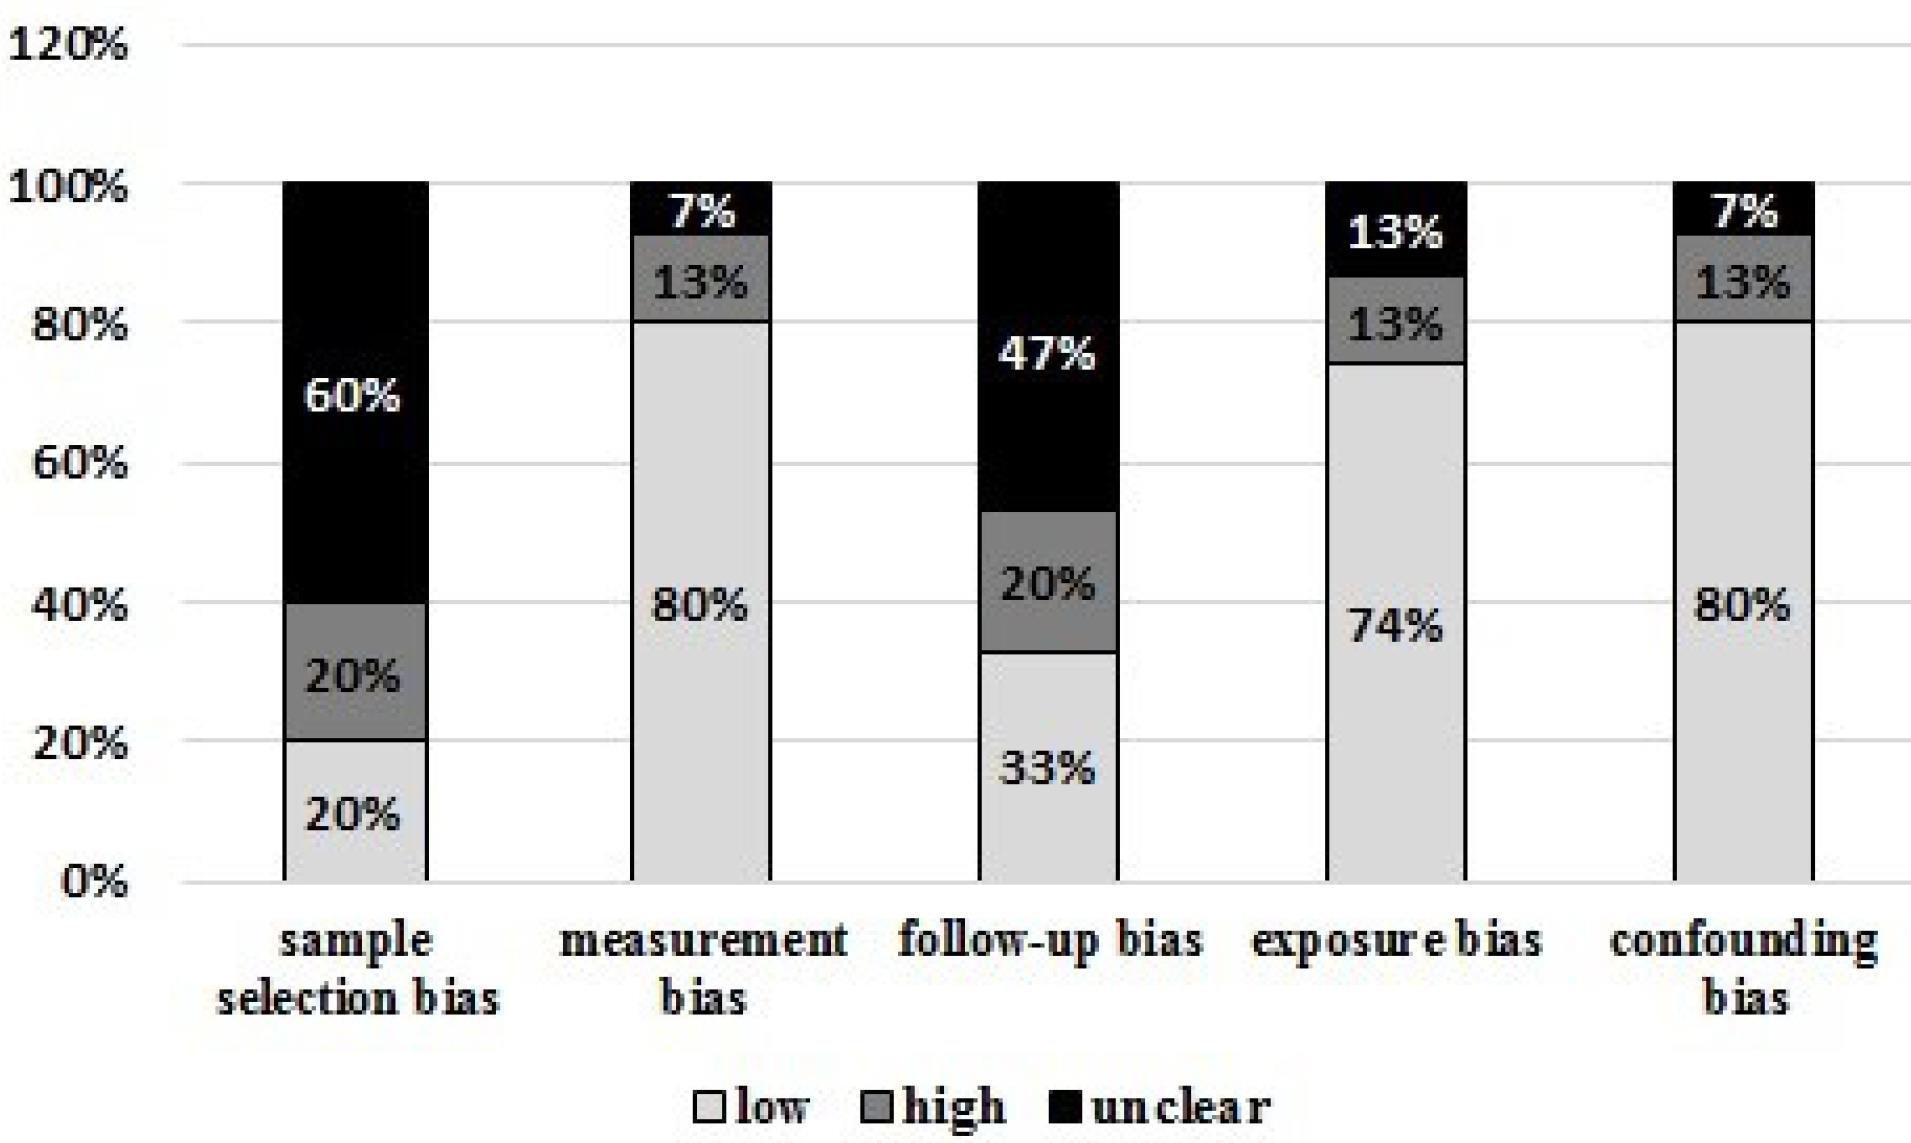
Figure 2.
The risk of bias assessment of the included studies. As it is known, most of the studies in terms of bias are low risk
.
The risk of bias assessment of the included studies. As it is known, most of the studies in terms of bias are low risk
Heterogeneity in cfDNA definition
The study results showed that the type of samples used to detect cfDNA were plasma, serum, tumor tissue samples, bone marrow, and peripheral blood.34,44,49 Also, the diagnostic methods, the time of isolation protocols, and sampling techniques were different in all studies based on extraction kits, so in most studies, QIAmp blood diagnostic kits were used; the most used method was qPCR.35,50
The cfDNA diagnostic panel (Diagnostic pattern: In some kits, it works only on genetic changes, but others consider epigenetic changes as well.) has been genetically modified for some genes and epigenetic alterations. Most studies in this panel have only identified genetic changes and mutations.33 In contrast, others have only examined epigenetic changes such as methylation,44 while some studies examined both mutations and methylation levels of these genes.46
Disease-related genes
The most commonly detected genetic alteration was MYCN amplification. In total, 6 of 17 studies analyzed MYCN only. Other mutations such as ALK, NSE/(LINE-1), RET, RASSF1A, and APC mutations were often observed, usually in combination with MYCN mutations. For epigenetic alterations, the most commonly investigated genes were ALK and RASSF1A. Other epigenetic alterations, such as those used by Chicard et al37 (MYCN, TERT, IGF1R), Van Roy et al38 (MYCN and LIN28B), Chicard et al41 (genes of the MAPK pathway or HERC2) were also included.
Sample type
Plasma, serum, peripheral blood, and bone marrow were used to detect cfDNA.
Relationship between cfDNA and Clinical profile
Several studies showed that cfDNA levels were associated with the time of onset of neuroblastoma. Furthermore, people with recent neuroblastoma had higher levels of cfDNA than those with long-term disease.43 In addition, cfDNA levels were seen earlier in the recurrence time of the disease than in the free time.26 The high levels of cfDNA can be considered as a biomarker for the recurrence of neuroblastoma. Moreover, the cfDNA levels are associated with the stage of the disease in neuroblastoma. As in patients with a lower stage, its values are less than those with a higher stage (stage 4). Overall, cfDNA levels are higher in patients with stage 4 than in stage 3 and patients with lower stages of the disease.33
Discussion
The results of this review indicated that patients with neuroblastoma have high levels of MYCN amplification, which has been evaluated by the fluorescent method in situ hybridization or qualitative PCR analysis. In another study using the NGS technique in neuroblastoma patients, multiple mutations in the ALK and RET genes were identified.33 MYCN originates in circulating cancer cells and is an essential factor in the follow-up and diagnosis of neuroblastoma patients.35,51
Whole-exome sequencing (WES) is used to study the genetic heterogeneity of patient samples previously. The result showed the high success of WES in sequencing cfDNA about treatment-resistant clones in neuroblastoma.34 Chicard et al and Van Roy et al showed that tumor genetic changes in cfDNA disappeared in treated patients. Also, tumor gene changes can be detected in the relapsing situation, and analyses show resistance to previous clones.37,38
According to some novel studies, patients with late-diagnosed neuroblastoma have higher neuron-specific enolase (NSE) and lactate dehydrogenase (LDH) levels than those with early-stage neuroblastoma. Monitoring is possible since levels of these proteins can show how a child’s tumor is progressing. Studies have reported lower levels of these biomarkers in newly diagnosed patients, and the cfDNA levels go higher with the tumor progression, and they were more helpful in diagnosis. we can use NSE and LDH markers to monitor NB patients.35,39,52 However, we should note that serum LDH and NSE levels are reduced in patients under treatment with 13-cis-retinoic acid.53 Furthermore, the 17q chromosome arm was found in the plasma of people with neuroblastoma, the most common chromosomal change in primary tumors. A higher level of the 17q chromosome was related to a higher stage of the disease, which helps to assess younger children.36
Nowadays, molecular methods have been used to study the recurrence rate and severity of the disease. MYCN level has been introduced as a diagnostic factor of neuroblastoma detected by FISH and PCR methods. The FISH method is invasive due to tissue sampling, so the results vary depending on the tissue’s quality. The PCR method is non-invasive and reproducible using serum sampling, and the experiments showed that MYCN amplification could be detected as a prognostic factor in neuroblastoma patients.35,34 In high-risk NB patients, the detection of two factors, including tyrosine hydroxylase (TH) and homeobox 2B mRNA (PHOX2B) using qPCR, can be considered as a particular method for the diagnosis of MRD.42 Although cfDNA and TH/ PHOX2B levels are challenging to determine in patients at high risk for neuroblastoma, the use of PCR to determine the levels of tyrosine hydroxylase and homeobox 2B at the mRNA level is a susceptible and specific method in diagnosing MRD and requires a threshold to determine MRD positivity. Moreover, cfDNA molecules are less expensive and more stable, and lower levels of cfDNA are required than mRNA.42
The cfDNA is degraded DNA-derived fragments by tissue macrophages and enters the bloodstream from tumor cells under apoptosis or necrosis. This circulating cfDNA can be a clinical and pathological factor in cancer progression. The high levels of Plasma cfDNA are associated with disease recurrence that could be investigated as a molecule marking the progression of NB, especially a potential biomarker in cancer metastasis.42 Therefore, dynamic alteration of cfDNA can be assessed as a biomarker for assessing tumor burden and MRD in children with neuroblastoma during the beginning and the middle of chemotherapy; cfDNA levels can be used to differentiate between partial remission (PR) and stable diseases (SD) conditions.26 Several factors can influence cfDNA levels, both positively and negatively. While the causes of sudden stimulation of cfDNA are important, it is also essential to consider other elements that can impact baseline levels of cfDNA in individuals. Patients with low tumor burden may additionally have lower ranges of cfDNA, as fewer tumor cells release DNA into the bloodstream. Patients who respond well to remedy may also have lower levels of cfDNA, as fewer tumor cells release DNA into the bloodstream. The amount of blood collected can affect cfDNA levels. Lower blood volumes can also lead to lower cfDNA levels due to dilution. The time of day when blood samples are collected can influence cfDNA levels. For example, cfDNA levels are lower in the morning than in the afternoon. Older patients can also have lower baseline levels of cfDNA. Considering these elements when interpreting cfDNA stages as a biomarker for tumor stage, progression, and recurrence is integral. In addition, more research is wished to recognize the impact of these factors on cfDNA ranges and how they may additionally affect the clinical utility of cfDNA as a biomarker.54
The qPCR method is more commonly used for measuring cfDNA because it is cost-effective, highly sensitive, requires only a small sample size, and is non-invasive. However, three factors cause sudden stimulation of cfDNA, including fever inflammation, injection and administration of granulocyte colony-stimulating factor (G-CSF), in which the peripheral blood cannot be sampled to measure cfDNA from non-tumor cells, tumor location, tumor severity, and other clinical factors that affect cfDNA levels.42,26 There is no significant relationship between tumor size and serum cfDNA level. However, there is evidence of increased cfDNA levels in advanced stages of neoplasms and more malignant cases such as lung, colon, and breast compared to benign tumors. The plasma DNA can estimate response, therapy, and prognosis.39
Susceptible NGS-based techniques may better assess the range of cfDNA changes throughout the tumor. In the early stages of the disease, especially in small tumors, there may be insufficient cfDNA to detect mutations in the blood.33
Conclusion
Taken together, cfDNA amplification can be involved in neuroblastoma. It was also found that cfDNA levels in some studies were associated with disease stage, as some have shown that people with recent neuroblastoma had higher levels of cfDNA than those with long-term disease. The results showed that MYCN and NSE genes are closely related to cfDNA levels in people with neuroblastoma.
Competing Interests
The authors of this article have no conflict of interest.
Ethical Approval
This project was carried out at Urmia University of Medical Sciences after obtaining a license and an ethics code number IR.UMSU.REC.1399.189.
Acknowledgements
The authors would like to thank the officials of Urmia University of Medical Sciences and the Student Research Committee for their support of this project.
References
- London WB, Castleberry RP, Matthay KK, Look AT, Seeger RC, Shimada H. Evidence for an age cutoff greater than 365 days for neuroblastoma risk group stratification in the Children’s Oncology Group. J Clin Oncol 2005; 23(27):6459-65. doi: 10.1200/jco.2005.05.571 [Crossref] [ Google Scholar]
- Ward E, DeSantis C, Robbins A, Kohler B, Jemal A. Childhood and adolescent cancer statistics, 2014. CA Cancer J Clin 2014; 64(2):83-103. doi: 10.3322/caac.21219 [Crossref] [ Google Scholar]
- Uryu K, Nishimura R, Kataoka K, Sato Y, Nakazawa A, Suzuki H. Identification of the genetic and clinical characteristics of neuroblastomas using genome-wide analysis. Oncotarget 2017; 8(64):107513-29. doi: 10.18632/oncotarget.22495 [Crossref] [ Google Scholar]
- Aygun N. Biological and genetic features of neuroblastoma and their clinical importance. Curr Pediatr Rev 2018; 14(2):73-90. doi: 10.2174/1573396314666180129101627 [Crossref] [ Google Scholar]
- Trochet D, Bourdeaut F, Janoueix-Lerosey I, Deville A, de Pontual L, Schleiermacher G. Germline mutations of the paired-like homeobox 2B (PHOX2B) gene in neuroblastoma. Am J Hum Genet 2004; 74(4):761-4. doi: 10.1086/383253 [Crossref] [ Google Scholar]
- Mossé YP, Laudenslager M, Longo L, Cole KA, Wood A, Attiyeh EF. Identification of ALK as a major familial neuroblastoma predisposition gene. Nature 2008; 455(7215):930-5. doi: 10.1038/nature07261 [Crossref] [ Google Scholar]
- Braoudaki M, Hatziagapiou K, Zaravinos A, Lambrou GI. MYCN in neuroblastoma: “old wine into new wineskins”. Diseases 2021; 9(4):78. doi: 10.3390/diseases9040078 [Crossref] [ Google Scholar]
- Bansal M, Gupta A, Ding HF. MYCN and metabolic reprogramming in neuroblastoma. Cancers (Basel) 2022; 14(17):4113. doi: 10.3390/cancers14174113 [Crossref] [ Google Scholar]
- Tolbert VP, Matthay KK. Neuroblastoma: clinical and biological approach to risk stratification and treatment. Cell Tissue Res 2018; 372(2):195-209. doi: 10.1007/s00441-018-2821-2 [Crossref] [ Google Scholar]
- Woods WG, Gao RN, Shuster JJ, Robison LL, Bernstein M, Weitzman S. Screening of infants and mortality due to neuroblastoma. N Engl J Med 2002; 346(14):1041-6. doi: 10.1056/NEJMoa012387 [Crossref] [ Google Scholar]
- Campbell K, Gastier-Foster JM, Mann M, Naranjo AH, Van Ryn C, Bagatell R. Association of MYCN copy number with clinical features, tumor biology, and outcomes in neuroblastoma: a report from the Children’s Oncology Group. Cancer 2017; 123(21):4224-35. doi: 10.1002/cncr.30873 [Crossref] [ Google Scholar]
- Ambros PF, Ambros IM, Brodeur GM, Haber M, Khan J, Nakagawara A. International consensus for neuroblastoma molecular diagnostics: report from the International Neuroblastoma Risk Group (INRG) Biology Committee. Br J Cancer 2009; 100(9):1471-82. doi: 10.1038/sj.bjc.6605014 [Crossref] [ Google Scholar]
- Schleiermacher G, Mosseri V, London WB, Maris JM, Brodeur GM, Attiyeh E. Segmental chromosomal alterations have prognostic impact in neuroblastoma: a report from the INRG project. Br J Cancer 2012; 107(8):1418-22. doi: 10.1038/bjc.2012.375 [Crossref] [ Google Scholar]
- Acord M, Shaikh R. Predictors of diagnostic success in image-guided pediatric soft-tissue biopsies. Pediatr Radiol 2015; 45(10):1529-34. doi: 10.1007/s00247-015-3364-2 [Crossref] [ Google Scholar]
- Bennett CW, Berchem G, Kim YJ, El-Khoury V. Cell-free DNA and next-generation sequencing in the service of personalized medicine for lung cancer. Oncotarget 2016; 7(43):71013-35. doi: 10.18632/oncotarget.11717 [Crossref] [ Google Scholar]
- Luo H, Wei W, Ye Z, Zheng J, Xu RH. Liquid biopsy of methylation biomarkers in cell-free DNA. Trends Mol Med 2021; 27(5):482-500. doi: 10.1016/j.molmed.2020.12.011 [Crossref] [ Google Scholar]
- Jahr S, Hentze H, Englisch S, Hardt D, Fackelmayer FO, Hesch RD. DNA fragments in the blood plasma of cancer patients: quantitations and evidence for their origin from apoptotic and necrotic cells. Cancer Res 2001; 61(4):1659-65. [ Google Scholar]
- Corcoran RB, Chabner BA. Application of cell-free DNA analysis to cancer treatment. N Engl J Med 2018; 379(18):1754-65. doi: 10.1056/NEJMra1706174 [Crossref] [ Google Scholar]
- Sturm D, Orr BA, Toprak UH, Hovestadt V, Jones DTW, Capper D. New brain tumor entities emerge from molecular classification of CNS-PNETs. Cell 2016; 164(5):1060-72. doi: 10.1016/j.cell.2016.01.015 [Crossref] [ Google Scholar]
- Chennakesavalu M, Moore K, Chaves G, Veeravalli S, TerHaar R, Wu T. 5-hydroxymethylcytosine profiling of cell-free DNA identifies bivalent genes that are prognostic of survival in high-risk neuroblastoma. JCO Precis Oncol 2024; 8:e2300297. doi: 10.1200/po.23.00297 [Crossref] [ Google Scholar]
- Siravegna G, Marsoni S, Siena S, Bardelli A. Integrating liquid biopsies into the management of cancer. Nat Rev Clin Oncol 2017; 14(9):531-48. doi: 10.1038/nrclinonc.2017.14 [Crossref] [ Google Scholar]
- De Vlaminck I, Valantine HA, Snyder TM, Strehl C, Cohen G, Luikart H. Circulating cell-free DNA enables noninvasive diagnosis of heart transplant rejection. Sci Transl Med 2014; 6(241):241ra77. doi: 10.1126/scitranslmed.3007803 [Crossref] [ Google Scholar]
- Salvi S, Gurioli G, De Giorgi U, Conteduca V, Tedaldi G, Calistri D. Cell-free DNA as a diagnostic marker for cancer: current insights. Onco Targets Ther 2016; 9:6549-59. doi: 10.2147/ott.S100901 [Crossref] [ Google Scholar]
- Rafi I, Chitty L. Cell-free fetal DNA and non-invasive prenatal diagnosis. Br J Gen Pract 2009; 59(562):e146-8. doi: 10.3399/bjgp09X420572 [Crossref] [ Google Scholar]
- Leon SA, Shapiro B, Sklaroff DM, Yaros MJ. Free DNA in the serum of cancer patients and the effect of therapy. Cancer Res 1977; 37(3):646-50. [ Google Scholar]
- Su Y, Wang L, Wang X, Yue Z, Xing T, Zhao W. Dynamic alterations of plasma cell free DNA in response to chemotherapy in children with neuroblastoma. Cancer Med 2019; 8(4):1558-66. doi: 10.1002/cam4.2045 [Crossref] [ Google Scholar]
- Lodrini M, Sprüssel A, Astrahantseff K, Tiburtius D, Konschak R, Lode HN. Using droplet digital PCR to analyze MYCN and ALK copy number in plasma from patients with neuroblastoma. Oncotarget 2017; 8(49):85234-51. doi: 10.18632/oncotarget.19076 [Crossref] [ Google Scholar]
- Bobin C, Iddir Y, Butterworth C, Masliah-Planchon J, Saint-Charles A, Bellini A. Sequential analysis of cfDNA reveals clonal evolution in patients with neuroblastoma receiving ALK-targeted therapy. Clin Cancer Res 2024; 30(15):3316-28. doi: 10.1158/1078-0432.Ccr-24-0753 [Crossref] [ Google Scholar]
- Boerner S, Squire J, Thorner P, McKenna G, Zielenska M. Assessment of MYCN amplification in neuroblastoma biopsies by differential polymerase chain reaction. Pediatr Pathol 1994; 14(5):823-32. doi: 10.3109/15513819409037680 [Crossref] [ Google Scholar]
- Trigg RM, Turner SD, Shaw JA, Jahangiri L. Diagnostic accuracy of circulating-free DNA for the determination of MYCN amplification status in advanced-stage neuroblastoma: a systematic review and meta-analysis. Br J Cancer 2020; 122(7):1077-84. doi: 10.1038/s41416-020-0740-y [Crossref] [ Google Scholar]
- Gotoh T, Hosoi H, Iehara T, Kuwahara Y, Osone S, Tsuchiya K. Prediction of MYCN amplification in neuroblastoma using serum DNA and real-time quantitative polymerase chain reaction. J Clin Oncol 2005; 23(22):5205-10. doi: 10.1200/jco.2005.02.014 [Crossref] [ Google Scholar]
- Higgins JP, Thomas J, Chandler J, Cumpston M, Li T, Page MJ, et al. Cochrane Handbook for Systematic Reviews of Interventions. John Wiley & Sons; 2019.
- Kurihara S, Ueda Y, Onitake Y, Sueda T, Ohta E, Morihara N. Circulating free DNA as non-invasive diagnostic biomarker for childhood solid tumors. J Pediatr Surg 2015; 50(12):2094-7. doi: 10.1016/j.jpedsurg.2015.08.033 [Crossref] [ Google Scholar]
- Combaret V, Audoynaud C, Iacono I, Favrot MC, Schell M, Bergeron C. Circulating MYCN DNA as a tumor-specific marker in neuroblastoma patients. Cancer Res 2002; 62(13):3646-8. [ Google Scholar]
- Ma Y, Lee JW, Park SJ, Yi ES, Choi YB, Yoo KH. Detection of MYCN amplification in serum DNA using conventional polymerase chain reaction. J Korean Med Sci 2016; 31(9):1392-6. doi: 10.3346/jkms.2016.31.9.1392 [Crossref] [ Google Scholar]
- Combaret V, Bréjon S, Iacono I, Schleiermacher G, Pierron G, Ribeiro A. Determination of 17q gain in patients with neuroblastoma by analysis of circulating DNA. Pediatr Blood Cancer 2011; 56(5):757-61. doi: 10.1002/pbc.22816 [Crossref] [ Google Scholar]
- Chicard M, Colmet-Daage L, Clement N, Danzon A, Bohec M, Bernard V. Whole-exome sequencing of cell-free DNA reveals temporo-spatial heterogeneity and identifies treatment-resistant clones in neuroblastoma. Clin Cancer Res 2018; 24(4):939-49. doi: 10.1158/1078-0432.Ccr-17-1586 [Crossref] [ Google Scholar]
- Van Roy N, Van Der Linden M, Menten B, Dheedene A, Vandeputte C, Van Dorpe J. Shallow whole genome sequencing on circulating cell-free DNA allows reliable noninvasive copy-number profiling in neuroblastoma patients. Clin Cancer Res 2017; 23(20):6305-14. doi: 10.1158/1078-0432.Ccr-17-0675 [Crossref] [ Google Scholar]
- Wang X, Wang L, Su Y, Yue Z, Xing T, Zhao W. Plasma cell-free DNA quantification is highly correlated to tumor burden in children with neuroblastoma. Cancer Med 2018; 7(7):3022-30. doi: 10.1002/cam4.1586 [Crossref] [ Google Scholar]
- Liu X, Zhang Z, Zhang B, Zheng Y, Zheng C, Liu B. Circulating tumor cells detection in neuroblastoma patients by EpCAM-independent enrichment and immunostaining-fluorescence in situ hybridization. EBioMedicine 2018; 35:244-50. doi: 10.1016/j.ebiom.2018.08.005 [Crossref] [ Google Scholar]
- Chicard M, Boyault S, Colmet Daage L, Richer W, Gentien D, Pierron G. Genomic copy number profiling using circulating free tumor DNA highlights heterogeneity in neuroblastoma. Clin Cancer Res 2016; 22(22):5564-73. doi: 10.1158/1078-0432.Ccr-16-0500 [Crossref] [ Google Scholar]
- Su Y, Wang L, Jiang C, Yue Z, Fan H, Hong H. Increased plasma concentration of cell-free DNA precedes disease recurrence in children with high-risk neuroblastoma. BMC Cancer 2020; 20(1):102. doi: 10.1186/s12885-020-6562-8 [Crossref] [ Google Scholar]
- Merugu S, Chen L, Gavens E, Gabra H, Brougham M, Makin G. Detection of circulating and disseminated neuroblastoma cells using the ImageStream flow cytometer for use as predictive and pharmacodynamic biomarkers. Clin Cancer Res 2020; 26(1):122-34. doi: 10.1158/1078-0432.Ccr-19-0656 [Crossref] [ Google Scholar]
- van Zogchel LMJ, van Wezel EM, van Wijk J, Stutterheim J, Bruins WS, Zappeij-Kannegieter L. Hypermethylated RASSF1A as circulating tumor DNA marker for disease monitoring in neuroblastoma. JCO Precis Oncol 2020; 4:291-306. doi: 10.1200/po.19.00261 [Crossref] [ Google Scholar]
- Peitz C, Sprüssel A, Linke RB, Astrahantseff K, Grimaldi M, Schmelz K. Multiplexed quantification of four neuroblastoma DNA targets in a single droplet digital PCR reaction. J Mol Diagn 2020; 22(11):1309-23. doi: 10.1016/j.jmoldx.2020.07.006 [Crossref] [ Google Scholar]
- Van Paemel R, De Koker A, Vandeputte C, van Zogchel L, Lammens T, Laureys G. Minimally invasive classification of paediatric solid tumours using reduced representation bisulphite sequencing of cell-free DNA: a proof-of-principle study. Epigenetics 2021; 16(2):196-208. doi: 10.1080/15592294.2020.1790950 [Crossref] [ Google Scholar]
- Kahana-Edwin S, Cain LE, McCowage G, Darmanian A, Wright D, Mullins A. Neuroblastoma molecular risk-stratification of DNA copy number and ALK genotyping via cell-free circulating tumor DNA profiling. Cancers (Basel) 2021; 13(13):3365. doi: 10.3390/cancers13133365 [Crossref] [ Google Scholar]
- Lodrini M, Graef J, Thole-Kliesch TM, Astrahantseff K, Sprüssel A, Grimaldi M. Targeted analysis of cell-free circulating tumor DNA is suitable for early relapse and actionable target detection in patients with neuroblastoma. Clin Cancer Res 2022; 28(9):1809-20. doi: 10.1158/1078-0432.Ccr-21-3716 [Crossref] [ Google Scholar]
- Yagyu S, Gotoh T, Iehara T, Miyachi M, Katsumi Y, Tsubai-Shimizu S. Circulating methylated-DCR2 gene in serum as an indicator of prognosis and therapeutic efficacy in patients with MYCN nonamplified neuroblastoma. Clin Cancer Res 2008; 14(21):7011-9. doi: 10.1158/1078-0432.Ccr-08-1249 [Crossref] [ Google Scholar]
- Yu Y, Zhang J, Jin Y, Yang Y, Shi J, Chen F. MiR-20a-5p suppresses tumor proliferation by targeting autophagy-related gene 7 in neuroblastoma. Cancer Cell Int 2018; 18:5. doi: 10.1186/s12935-017-0499-2 [Crossref] [ Google Scholar]
- Ruas JS, Silva FLT, Euzébio MF, Biazon TO, Daiggi CM, Nava D. Somatic copy number alteration in circulating tumor DNA for monitoring of pediatric patients with cancer. Biomedicines 2023; 11(4):1082. doi: 10.3390/biomedicines11041082 [Crossref] [ Google Scholar]
- Ferraro S, Braga F, Luksch R, Terenziani M, Caruso S, Panteghini M. Measurement of serum neuron-specific enolase in neuroblastoma: is there a clinical role?. Clin Chem 2020; 66(5):667-75. doi: 10.1093/clinchem/hvaa073 [Crossref] [ Google Scholar]
- van Zogchel LM, Lak NS, Gelineau NU, Sergeeva I, Stelloo E, Swennenhuis J. Targeted locus amplification to develop robust patient-specific assays for liquid biopsies in pediatric solid tumors. Front Oncol 2023; 13:1124737. doi: 10.3389/fonc.2023.1124737 [Crossref] [ Google Scholar]
- Bronkhorst AJ, Ungerer V, Oberhofer A, Gabriel S, Polatoglou E, Randeu H. New perspectives on the importance of cell-free DNA biology. Diagnostics (Basel) 2022; 12(9):2147. doi: 10.3390/diagnostics12092147 [Crossref] [ Google Scholar]